-
-
-
-
-
-
-
-
-
-
-
About this
Report
Chairman's
Foreword
Corporate
Management Report Appendices Governance
Consolidated Financial Company Financial
Statements Statements
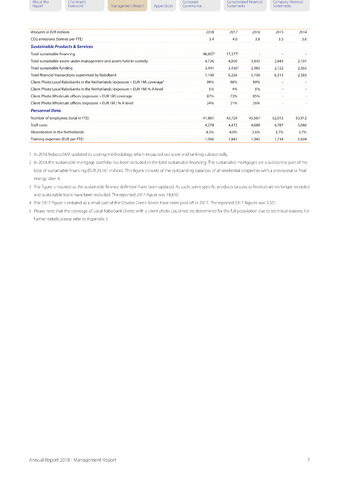
Amounts in EUR millions
2018
2017
2016
2015
2014
C02 emissions (tonnes per FTE)
3.4
4.0
3.8
3.5
3.6
Sustainable Products Services
Total sustainable financing
46,6072
17,3773
Total sustainable assets under management and assets held in custody
4,726
4,030
3,835
2,843
2,101
Total sustainable funding
3,941
3,4364
2,985
2,122
2,365
Total financial transactions supervised by Rabobank
7,140
6,236
5,750
6,313
2,383
Client Photo Local Rabobanks in the Netherlands (exposure EUR 1M) coverage5
99%
98%
99%
Client Photo Local Rabobanks in the Netherlands (exposure EUR 1M) A-level
5%
4%
5%
Client Photo Wholesale offices (exposure EUR 1M) coverage
87%
73%
85%
Client Photo Wholesale offices (exposure EUR 1M A-level
24%
21%
26%
Personnel Data
Number of employees (total in FTE)
41,861
43,729
45,567
52,013
53,912
Staff costs
4,278
4,472
4,680
4,787
5,086
Absenteeism in the Netherlands
4.3%
4.0%
3.6%
3.7%
3.7%
Training expenses (EUR per FTE)
1,906
1,841
1,945
1,734
1,604
1 In 2018 RobecoSAM updated its scoring methodology which impacted our score and ranking substantially.
2 In 2018 the sustainable mortgage portfolio has been included in the total sustainable financing. The sustainable mortgages are a substantial part of the
total of sustainable financing (EUR 29,161 million). This figure consists of the outstanding balances of all residential properties with a provisional or final
energy label A.
3 The figure is restated as the sustainable finance definition have been updated. As such, some specific products (access to finance) are no longer recorded
and sustainable loans have been included. The reported 2017-figure was 18,610.
4 The 2017-figure is restated as a small part of the Obvion Green Bonds have been paid off in 2017. The reported 2017-figures was 3,501
5 Please note that the coverage of Local Rabobank clients with a client photo could not be determined for the full population due to technical reasons. For
further details please refer to Appendix 3.
Annual Report 2018 - Management Report
7