About this
Report
Chairman's
Foreword
Corporate
Management Report Appendices Governance
Consolidated Financial Company Financial
Statements Statements
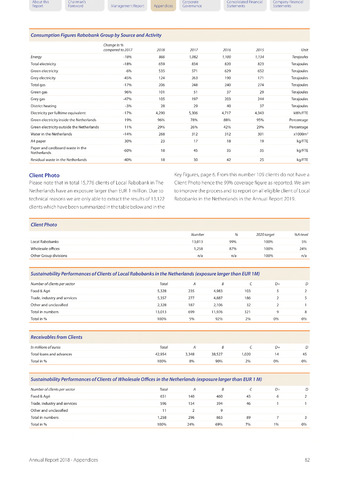
Consumption Figures Rabobank Group by Source and Activity
Change in
compared to 2017
2018
2017
2016
2015
Unit
Energy
-18%
866
1,082
1,100
1,134
Terajoules
Total electricity
-18%
659
834
820
823
Terajoules
Green electricity
-6%
535
571
629
652
Terajoules
Grey electricity
-45%
124
263
190
171
Terajoules
Total gas
-17%
206
248
240
274
Terajoules
Green gas
96%
101
51
37
29
Terajoules
Grey gas
-47%
105
197
203
244
Terajoules
District heating
-3%
28
29
40
37
Terajoules
Electricity per fulltime equivalent
-17%
4,290
5,306
4,717
4,343
kWh/FTE
Green electricity inside the Netherlands
19%
96%
78%
88%
95%
Percentage
Green electricity outside the Netherlands
11%
29%
26%
42%
29%
Percentage
Water in the Netherlands
-14%
268
312
312
301
x1000m3
A4 paper
30%
23
17
18
19
kg/FTE
Paper and cardboard waste in the
Netherlands
-60%
18
45
35
35
kg/FTE
Residual waste in the Netherlands
-40%
18
30
42
25
kg/FTE
Client Photo
Please note that in total 15,776 clients of Local Rabobank in The
Netherlands have an exposure larger than EUR 1 million. Due to
technical reasons we are only able to extract the results of 13,122
clients which have been summarized in the table below and in the
Key Figures, page 6. From this number 109 clients do not have a
Client Photo hence the 99% coverage figure as reported. We aim
to improve the process and to report on all eligible client of Local
Rabobanks in the Netherlands in the Annual Report 2019.
Client Photo
Number 2020 target %A-level
Local Rabobanks 13,013 99% 100% 5%
Wholesale offices 1,258 87% 100% 24%
Other Group divisions n/a n/a 100% n/a
Sustainability Performances of Clients of Local Rabobanks in the Netherlands (exposure larger than EUR 1M)
Number of clients per sector Total A B C D+ D
Food Agri 5,328 235 4,983 103 5 2
Trade, industry and services 5,357 277 4,887 186 2 5
Other and unclassified 2,328 187 2,106 32 2 1
Total in numbers 13,013 699 11,976 321 9 8
Total in 100% 5% 92% 2% 0% 0%
Receivables from Clients
In millions of euros Total A B C D+ D
Total loans and advances 42,954 3,348 38,527 1,020 14 45
Total in 100% 8% 90% 2% 0% 0%
Sustainability Performances of Clients of Wholesale Offices in the Netherlands (exposure larger than EUR 7 M)
Number of clients per sector Total A B C D+ D
Food Agri 651 140 460 43 6 2
Trade, industry and services 596 154 394 46 1 1
Other and unclassified 11 2 9
Total in numbers 1,258 296 863 89 7 3
Total in 100% 24% 69% 7% 1% 0%
Annual Report 2018 - Appendices 82