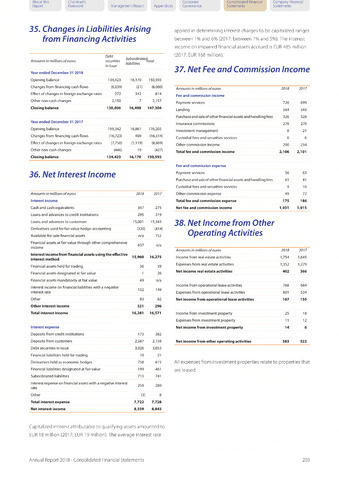
35. Changes in Liabilities Arising
from Financing Activities
36. Net Interest Income
37. Net Fee and Commission Income
38. Net Income from Other
Operating Activities
About this
Report
Chairman's
Foreword
Corporate
Management Report Appendices Governance
Consolidated Financial Company Financial
Statements Statements
Debt
Amounts in millions of euros securities
in issue
Year ended December 31 2018
Opening balance 134,423
Changes from financing cash flows (6,039)
Effect of changes in foreign exchange rates 272
Other non-cash changes 2,150
Closing balance 130,806
Year ended December 31 2017
Opening balance 159,342
Changes from financing cash flows (16,723)
Effect of changes in foreign exchange rates (7,750)
Other non-cash changes (446)
Closing balance 134,423
Amounts in millions of euros
2018
2017
Interest income
Cash and cash equivalents
347
275
Loans and advances to credit institutions
295
319
Loans and advances to customers
15,001
15,343
Derivatives used for fair value hedge-accounting
(320)
(414)
Available-for-sale financial assets
n/a
752
Financial assets at fair value through other comprehensive
income
637
n/a
Interest incomefrom financial assets using the effective
interest method
15,960
16,275
Financial assets held for trading
36
39
Financial assets designated at fair value
1
26
Financial assets mandatorily at fair value
49
n/a
Interest income on financial liabilities with a negative
interest rate
152
149
Other
83
82
Other interest income
321
296
Total interest income
16,281
16,571
Interest expense
Deposits from credit institutions
173
382
Deposits from customers
2,587
2,158
Debt securities in issue
3,026
3,053
Financial liabilities held for trading
10
21
Derivatives held as economic hedges
758
615
Financial liabilities designated at fair value
199
461
Subordinated liabilities
713
741
Interest expense on financial assets with a negative interest
rate
259
289
Other
(3)
8
Total interest expense
7,722
7,728
Net interest income
8,559
8,843
Capitalized interest attributable to qualifying assets amounted to
EUR 18 million (2017: EUR 19 million). The average interest rate
applied in determining interest charges to be capitalized ranges
between 1% and 6% (2017: between 1% and 5%). The interest
income on impaired financial assets accrued is EUR 485 million
(2017: EUR 168 million).
Amounts in millions of euros
2018
2017
Fee and commission income
Payment services
726
699
Lending
564
543
Purchaseandsaleof other financial assets and handling fees
326
328
Insurance commissions
276
270
Investment management
8
21
Custodial fees and securities services
6
6
Other commission income
200
234
Total fee and commission income
2,106
2,101
Fee and commission expense
Payment services
56
63
Purchase and sale of other financial assets and handling fees
61
41
Custodial fees and securities services
9
10
Other commission expense
49
72
Total fee and commission expense
175
186
Net fee and commission income
1,931
1,915
Amounts in millions of euros 2018 2017
Income from real estate activities 1,754 1,645
Expenses from real estate activities 1,352 1,279
Net income real estate activities 402 366
Income from operational lease activities 768 684
Expenses from operational lease activities 601 534
Net income from operational lease activities 167 150
Income from investment property 25 18
Expenses from investment property 11 12
Net income from investment property 14 6
Net income from other operating activities 583 522
All expenses from investment properties relate to properties that
are leased.
Subordinated^.^!
liabilities
16,170
150,593
(21)
(6,060)
342
614
7
2,157
16,498
147,304
16,861
176,203
409
(16,314)
(1,119)
(8,869)
19
(427)
16,170
150,593
Annual Report 2018 - Consolidated Financial Statements
203