-
-
-
-
-
-
-
-
-
-
-
-
-
-
-
-
-
-
-
-
-
-
-
-
-
-
-
-
-
-
About this
Report
Chairman's
Foreword
Corporate
Management Report Appendices Governance
Consolidated Financial Company Financial
Statements Statements
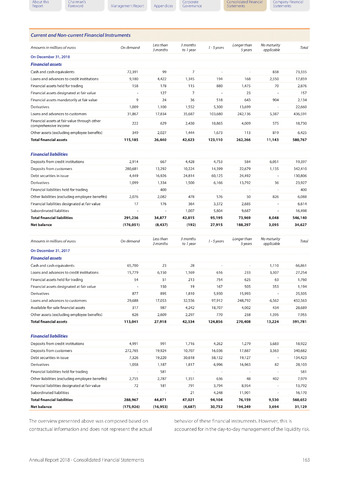
Current and Non-current Financial Instruments
Amounts in millions of euros
On demand
Less than
3 months
3 months
to 1 year
1 -5 years
Longer than
5 years
No maturity
applicable
Total
On December 312018
Financial assets
Cash and cash equivalents
72,391
99
7
838
73,335
Loans and advances to credit institutions
9,180
4,422
1,345
194
168
2,550
17,859
Financial assets held for trading
158
178
115
880
1,475
70
2,876
Financial assets designated at fair value
127
7
23
157
Financial assets mandatorily at fair value
9
24
36
518
643
904
2,134
Derivatives
1,009
1,100
1,552
5,300
13,699
22,660
Loans and advances to customers
31,867
17,834
35,687
103,680
242,136
5,387
436,591
Financial assets at fair value through other
comprehensive income
222
629
2,430
10,865
4,009
575
18,730
Other assets (excluding employee benefits)
349
2,027
1,444
1,673
113
819
6,425
Total financial assets
115,185
26,440
42,623
123,110
262,266
11,143
580,767
Financial liabilities
Deposits from credit institutions
2,914
667
4,428
4,753
584
6,051
19,397
Deposits from customers
280,681
13,292
10,224
14,399
22,679
1,135
342,410
Debt securities in issue
4,449
16,926
24,814
60,125
24,492
130,806
Derivatives
1,099
1,334
1,500
6,166
13,792
36
23,927
Financial liabilities held for trading
400
400
Other liabilities (excluding employee benefits)
2,076
2,082
478
576
50
826
6,088
Financial liabilities designated at fair value
17
176
364
3,372
2,685
6,614
Subordinated liabilities
1,007
5,804
9,687
16,498
Total financial liabilities
291,236
34,877
42,815
95,195
73,969
8,048
546,140
Net balance
(176,051)
(8,437)
(192)
27,915
188,297
3,095
34,627
Amounts in millions of euros
On demand
Less than
3 months
3 months
to 1 year
7 -5 years
Longer than
5 years
No maturity
applicable
Total
On December 312017
Financial assets
Cash and cash equivalents
65,700
23
28
1,110
66,861
Loans and advances to credit institutions
15,779
6,150
1,169
616
233
3,307
27,254
Financial assets held for trading
54
51
213
754
625
63
1,760
Financial assets designated at fair value
150
19
167
505
353
1,194
Derivatives
877
895
1,810
5,930
15,993
25,505
Loans and advances to customers
29,688
17,053
32,556
97,912
248,792
6,562
432,563
Available-for-sale financial assets
317
987
4,242
18,707
4,002
434
28,689
Other assets (excluding employee benefits)
626
2,609
2,297
770
258
1,395
7,955
Total financial assets
113,041
27,918
42,334
124,856
270,408
13,224
591,781
Financial liabilities
Deposits from credit institutions
4,991
991
1,716
4,262
1,279
5,683
18,922
Deposits from customers
272,765
19,924
10,707
16,036
17,887
3,363
340,682
Debt securities in issue
7,326
19,220
30,618
58,132
19,127
134,423
Derivatives
1,058
1,187
1,817
6,996
16,963
82
28,103
Financial liabilities held for trading
581
581
Other liabilities (excluding employee benefits)
2,755
2,787
1,351
636
48
402
7,979
Financial liabilities designated at fair value
72
181
791
3,794
8,954
13,792
Subordinated liabilities
21
4,248
11,901
16,170
Total financial liabilities
288,967
44,871
47,021
94,104
76,159
9,530
560,652
Net balance
(175,926)
(16,953)
(4,687)
30,752
194,249
3,694
31,129
The overview presented above was composed based on behavior of these financial instruments. However, this is
contractual information and does not represent the actual accounted for in the day-to-day management ofthe liquidity risk.
Annual Report 2018 - Consolidated Financial Statements
163