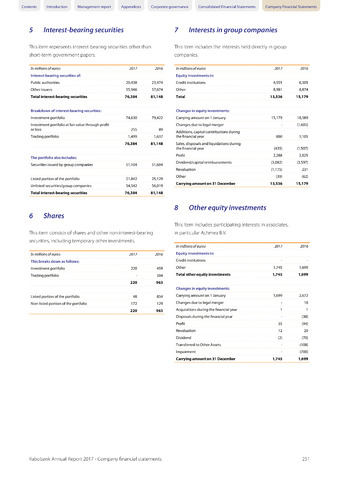
5 Interest-bearing securities
Interests in group companies
-
8 Other equity investments
6 Shares
-
-
-
-
-
Contents Introduction Management report Appendices Corporate governance Consolidated Financial Statements Company Financial Statements
This item represents interest-bearing securities other than
short-term government papers.
This item includes the interests held directly in group
companies.
In millions of euros
Interest-bearing securities of:
Public authorities
Other issuers
Total interest-bearing securities
Breakdown of interest-bearing securities:
Investment portfolio
Investment portfolio at fair value through profit
or loss
Trading portfolio
The portfolio also includes:
Securities issued by group companies
Listed portion of the portfolio
Unlisted securities/group companies
Total interest-bearing securities
20,438
55,946
76,384
74,630
255
1,499
76,384
51,104
21,842
54,542
76,384
23,474
57,674
81,148
79,422
1,637
81,148
51,604
25,129
56,019
81,148
In millions of euros
2017
2016
Equity investments in:
Credit institutions
4,555
6,305
Other
8,981
8,874
Total
13,536
15,179
Changes in equity investments:
Carrying amount on 1 January
15,179
18,589
Changes due to legal merger
(1,605)
Additions, capital contributions during
the financial year
800
1,105
Sales, disposals and liquidations during
the financial year
(435)
(1,507)
Profit
2,288
2,025
Dividend/capital reimbursements
(3,082)
(3,597)
Revaluation
(1,175)
231
Other
(39)
(62)
Carrying amount on 31 December
13,536
15,179
This item includes participating interests in associates,
This item consists of shares and other non-interest-bearing in particular Achmea B.V.
securities, including temporary other investments.
In millions of euros
2017
2016
In millions of euros
2017
2016
Equity investments in:
This breaks down as follows:
Credit institutions
Investment portfolio
220
459
Other
1,745
1,699
Trading portfolio
220
504
963
Total other equity investments
Changes in equity investments:
1,745
1,699
Listed portion of the portfolio
48
834
Carrying amount on 1 January
1,699
2,672
Non-listed portion of the portfolio
172
220
129
963
Changes due to legal merger
Acquisitions during the financial year
1
16
1
Disposals during the financial year
(38)
Profit
35
(94)
Revaluation
12
20
Dividend
(2)
(70)
Transferred to Other Assets
(108)
Impairment
(700)
Carrying amount on 31 December
1,745
1,699
Rabobank Annual Report 2017 - Company financial statements
251