-
-
Contents Introduction Management report Appendices Corporate governance Consolidated Financial Statements Company Financial Statements
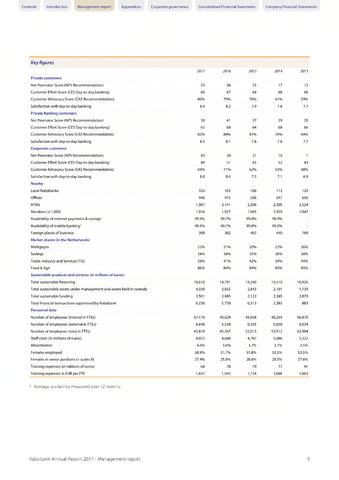
Key figures
2017
2016
2015
2014
2013
Private customers
Net Promotor Score (NPS Recommendation)
53
36
33
17
12
Customer Effort Score (CES Day-to-day banking)
66
67
64
68
66
Customer Advocacy Score (CAS Recommendation)
80%
79%
76%
61%
59%
Satisfaction with day-to-day banking
8.4
8.2
7.9
7.8
7.7
Private Banking customers
Net Promotor Score (NPS Recommendation)
50
41
37
29
20
Customer Effort Score (CES Day-to-day banking)
65
68
64
68
66
Customer Advocacy Score (CAS Recommendation)
82%
84%
81%
70%
64%
Satisfaction with day-to-day banking
8.4
8.1
7.8
7.8
7.7
Corporate customers
Net Promotor Score (NPS Recommendation)
43
30
21
10
1
Customer Effort Score (CES Day-to-day banking)
49
51
43
52
43
Customer Advocacy Score (CAS Recommendation)
69%
71%
62%
53%
48%
Satisfaction with day-to-day banking
8.0
8.4
7.3
7.1
6.9
Nearby
Local Rabobanks
102
103
106
113
129
Offices
446
475
506
547
656
ATMs
1,967
2,141
2,206
2,305
2,524
Members (x 1,000)
1,916
1,927
1,945
1,959
1,947
Availability of internet payments savings1
99.9%
99.7%
99.8%
98.9%
Availability of mobile banking1
99.9%
99.7%
99.8%
99.0%
Foreign places of business
389
382
403
440
769
Market shares (in the Netherlands)
Mortgages
22%
21%
20%
22%
26%
Savings
34%
34%
35%
36%
38%
Trade, Industry and Services (TIS)
39%
41%
42%
39%
44%
Food Agri
86%
84%
84%
85%
85%
Sustainable products and services (in millions of euros)
Total sustainable financing
18,610
18,791
19,240
19,510
18,926
Total sustainable assets under management and assets held in custody
4,030
3,835
2,843
2,101
1,739
Total sustainable funding
3,501
2,985
2,122
2,365
2,870
Total financial transactions supervised by Rabobank
6,236
5,750
6,313
2,383
883
Personnel data
Number of employees (internal in FTEs)
37,170
40,029
45,658
48,254
56,870
Number of employees (external in FTEs)
6,640
5,538
6,355
5,658
6,034
Number of employees (total in FTEs)
43,810
45,567
52,013
53,912
62,904
Staff costs (in millions of euros)
4,472
4,680
4,787
5,086
5,322
Absenteeism
4.0%
3.6%
3.7%
3.7%
3.5%
Females employed
50.9%
51.7%
51.8%
53.3%
53.5%
Females in senior positions scales 8)
27.4%
25.8%
28.6%
28.5%
27.6%
Training expenses (in millions of euros)
68
78
79
77
91
Training expenses in EUR per FTE
1,837
1,945
1,734
1,604
1,603
1 Average availability measured over 12 months
Rabobank Annual Report 2017 - Management report
9