-
-
-
-
-
-
-
-
-
-
-
-
-
-
-
-
-
-
Contents Foreword Management report Corporate governance Consolidated Financial Statements Company Financial Statements Pillar 3
in millions of euros
Level 1
Level 2
Level 3
Total
On 31 December 2016
Assets carried at amortised cost in the statement of financial position
Cash and balances at central banks
84,379
26
84,405
Loans and advances to banks
24,554
814
25,368
Loans and advances to customers
263
121,231
343,784
465,278
Assets carried at fair value in the statement of financial position
Financial assets held for trading
2,011
485
89
2,585
Financial assets designated at fair value
48
759
514
1,321
Derivatives
18
41,819
535
42,372
Available-for-sale financial assets
29,693
4,347
540
34,580
Non-current assets held for sale and discontinued operations
281
281
Liabilities carried at amortised cost in the statement of financial position
Deposits from banks
14,672
7,370
22,042
Deposits from customers
6,487
59,826
286,914
353,227
Debt securities in issue
1,476
135,078
27,068
163,622
Subordinated liabilities
18,256
18,256
Liabilities carried at fair value in the statement of financial position
Derivatives
21
47,479
524
48,024
Financial liabilities held for trading
739
739
Financial liabilities designated at fair value
9
16,498
13
16,520
in millions of euros
Level 1
Level 2
Level 3
Total
On 31 December 2015
Assets carried at amortised cost in the statement of financial position
Cash and balances at central banks
64,929
9
5
64,943
Loans and advances to banks
31,634
919
32,553
Loans and advances to customers
133,323
340,289
473,612
Assets carried at fair value in the statement of financial position
Financial assets held for trading
2,385
961
126
3,472
Financial assets designated at fair value
24
1,187
985
2,196
Derivatives
39
47,309
765
48,113
Available-for-sale financial assets
33,068
4,111
594
37,773
Non-current assets held for sale and discontinued operations
155
155
Liabilities carried at amortised cost in the statement of financial position
Deposits from banks
18,209
868
19,077
Deposits from customers
5,017
85,782
259,720
350,519
Debt securities in issue
1,593
152,351
24,533
178,477
Subordinated liabilities
16,558
16,558
Liabilities carried at fair value in the statement of financial position
Derivatives
26
53,842
688
54,556
Financial liabilities held for trading
552
21
573
Financial liabilities designated at fair value
16,967
24
16,991
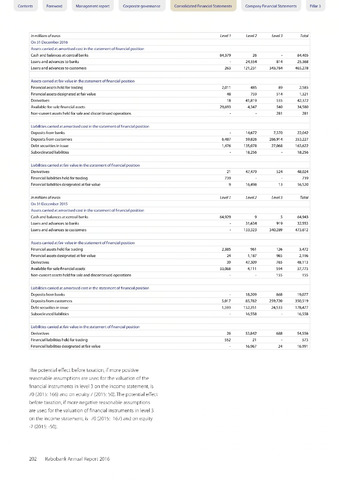
The potential effect before taxation, if more positive
reasonable assumptions are used for the valuation of the
financial instruments in level 3 on the income statement, is
70 (2015: 166) and on equity 7 (2015: 50). The potential effect
before taxation, if more negative reasonable assumptions
are used for the valuation of financial instruments in level 3
on the income statement, is -70 (2015: -167) and on equity
-7 (2015: -50).
202 Rabobank Annual Report 2016