-
-
-
-
Contents Foreword Management report Corporate governance
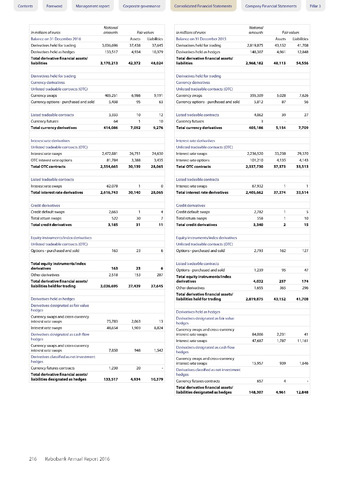
in millions of euros
Notional
amounts
Fair values
Balance on 31 December 2016
Assets
Liabilities
Derivatives held for trading
3,036,696
37,438
37,645
Derivatives held as hedges
133,517
4,934
10,379
Total derivative financial assets/
liabilities
3,170,213
42,372
48,024
Derivatives held for trading
Currency derivatives
Unlisted tradeable contracts (OTC)
Currency swaps
405,251
6,986
9,191
Currency options - purchased and sold
5,438
95
63
Listed tradeable contracts
3,333
10
12
Currency futures
64
1
10
Total currency derivatives
414,086
7,092
9,276
Interest rate derivatives
Unlisted tradeable contracts (OTC)
Interest rate swaps
2,472,881
26,751
24,630
OTC interest rate options
81,784
3,388
3,435
Total OTC contracts
2,554,665
30,139
28,065
Listed tradeable contracts
Interest rate swaps
62,078
1
0
Total interest rate derivatives
2,616,743
30,140
28,065
Credit derivatives
Credit default swaps
2,663
1
4
Total return swaps
522
30
7
Total credit derivatives
3,185
31
11
Equity instruments/index derivatives
Unlisted tradeable contracts (OTC)
Options - purchased and sold
163
23
6
Total equity instruments/index
derivatives
163
23
6
Other derivatives
2,518
153
287
Total derivative financial assets/
liabilities held for trading
3,036,695
37,439
37,645
Derivatives held as hedges
Derivatives designated as fair value
hedges
Currency swaps and cross-currency
interest rate swaps
75,783
2,063
13
Interest rate swaps
48,654
1,903
8,824
Derivatives designated as cash flow
hedges
Currency swaps and cross-currency
interest rate swaps
7,850
948
1,542
Derivatives classified as net investment
hedges
Currency futures contracts
1,230
20
Total derivative financial assets/
liabilities designated as hedges
133,517
4,934
10,379
Consolidated Financial Statements Company Financial Statements Pillar 3
in millions of euros
Notional
amounts
Fair values
Balance on 31 December 2015
Assets
Liabilities
Derivatives held for trading
2,819,875
43,152
41,708
Derivatives held as hedges
148,307
4,961
12,848
Total derivative financial assets/
liabilities
2,968,182
48,113
54,556
Derivatives held for trading
Currency derivatives
Unlisted tradeable contracts (OTC)
Currency swaps
395,309
5,028
7,626
Currency options - purchased and sold
5,812
87
56
Listed tradeable contracts
4,062
39
27
Currency futures
3
Total currency derivatives
405,186
5,154
7,709
Interest rate derivatives
Unlisted tradeable contracts (OTC)
Interest rate swaps
2,236,520
33,238
29,370
Interest rate options
101,210
4,135
4,143
Total OTC contracts
2,337,730
37,373
33,513
Listed tradeable contracts
Interest rate swaps
67,932
1
1
Total interest rate derivatives
2,405,662
37,374
33,514
Credit derivatives
Credit default swaps
2,782
1
5
Total return swaps
558
1
10
Total credit derivatives
3,340
2
15
Equity instruments/index derivatives
Unlisted tradeable contracts (OTC)
Options - purchased and sold
2,793
162
127
Listed tradeable contracts
Options - purchased and sold
1,239
95
47
Total equity instruments/index
derivatives
4,032
257
174
Other derivatives
1,655
365
296
Total derivative financial assets/
liabilities held for trading
2,819,875
43,152
41,708
Derivatives held as hedges
Derivatives designated as fair value
hedges
Currency swaps and cross-currency
interest rate swaps
84,006
2,231
41
Interest rate swaps
47,687
1,787
11,161
Derivatives designated as cash flow
hedges
Currency swaps and cross-currency
interest rate swaps
15,957
939
1,646
Derivatives classified as net investment
hedges
Currency futures contracts
657
4
Total derivative financial assets/
liabilities designated as hedges
148,307
4,961
12,848
216 Rabobank Annual Report 2016