Key figures
-
-
-
-
-
-
-
-
-
-
Contents Foreword Management report Corporate governance Consolidated Financial Statements Company Financial Statements Pillar 3
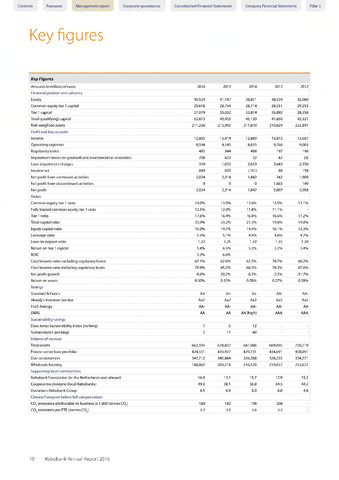
Key Figures
Amounts in millions of euros
2016
2015
2014
2013
2012
Financial position and solvency
Equity
40,524
41,197
38,871
38,534
42,080
Common equity tier 1 capital
29,618
28,754
28,714
28,551
29,253
Tier 1 capital
37,079
35,052
33,874
35,092
38,358
Total (qualifying) capital
52,873
49,455
45,139
41,650
42,321
Risk-weighted assets
211,226
213,092
211,870
210,829
222,847
Profit and loss account
Income
12,805
13,014
12,889
13,072
13,607
Operating expenses
8,594
8,145
8,055
9,760
9,003
Regulatory levies
483
344
488
197
196
Impairment losses on goodwill and investments in associates
700
623
32
42
(9)
Loan impairment charges
310
1,033
2,633
2,643
2,350
Income tax
694
655
(161)
88
158
Net profit from continued activities
2,024
2,214
1,842
342
1,909
Net profit from discontinued activities
0
0
0
1,665
149
Net profit
2,024
2,214
1,842
2,007
2,058
Ratios
Common equity tier 1 ratio
14.0%
13.5%
13.6%
13.5%
13.1%
Fully loaded common equity tier 1 ratio
13.5%
12.0%
11.8%
11.1%
Tier 1 ratio
17.6%
16.4%
16.0%
16.6%
17.2%
Total capital ratio
25.0%
23.2%
21.3%
19.8%
19.0%
Equity capital ratio
15.0%
14.7%
14.4%
16.1%
15.3%
Leverage ratio
5.5%
5.1%
4.9%
4.8%
4.7%
Loan-to-deposit ratio
1.22
1.25
1.32
1.35
1.39
Return on tier 1 capital
5.8%
6.5%
5.2%
5.2%
5.4%
ROIC
5.2%
6.0%
Cost/income ratio excluding regulatory levies
67.1%
62.6%
62.5%
74.7%
66.2%
Cost/income ratio including regulatory levies
70.9%
65.2%
66.3%
76.2%
67.6%
Net profit growth
-8.6%
20.2%
-8.2%
-2.5%
-21.7%
Return on assets
0.30%
0.33%
0.28%
0.27%
0.28%
Ratings
Standard Poor's
A+
A+
A+
AA-
AA-
Moody's Investors Service
Aa2
Aa2
Aa2
Aa2
Aa2
Fitch Ratings
AA-
AA-
AA-
AA-
AA
DBRS
AA
AA
AA (high)
AAA
AAA
Sustainability ratings
Dow Jones Sustainability Index (ranking)
7
5
12
Sustainalytics (ranking)
2
11
40
Volume of services
Total assets
662,593
678,827
681,086
669,095
750,710
Private sector loan portfolio
424,551
433,927
429,731
434,691
458,091
Due to customers
347,712
345,884
326,288
326,222
334,271
Wholesale funding
188,862
203,218
216,529
219,057
253,672
Supporting local communities
Rabobank Foundation (in the Netherlands and abroad)
16.9
13.1
15.7
12.9
15.2
Cooperative dividend (local Rabobanks)
49.0
38.1
36.8
44.5
44.2
Donations Rabobank Group
6.5
6.9
8.0
8.0
4.6
Climate Footprint before full compensation
CO2 emissions attributable to business (x 1,000 tonnes CO2)
180
182
198
208
CO2 emissions per FTE (tonnes CO2)
3.7
3.5
3.6
3.5
10 Rabobank Annual Report 2016