Financial results of leasing
Notes to financial results of leasing
Contents Management report Corporate governance Consolidated financial statements Financial statements Pillar 3
Results
in millions of euros
Net interest income
Net fee and commission income
Other income
Total income
Staff expenses
Other administrative expenses
Depreciation
Operating expenses
Gross result
Impairment losses on goodwill
Loan impairment charges
Contribution to resolution fund
Bank tax and levy
Operating profit before taxation
Taxation
Net profit
2015
1,094
57
568
1,719
601
277
38
916
803
10
85
9
10
689
191
498
2014
1,000
30
548
1,578
535
251
48
834
744
9
604
168
436
Movement
9%
12%
10%
-21%
10%
11%
14%
14%
14%
Loan impairment charges (in basis points)
25
43
-42%
Ratios
Cost/income ratio exclusive regulatory levies
Cost/income ratio inclusive regulatory levies
RAROC
53.3
54.4
27.4
52.9%
53.4%
31.2%
Balance sheet information (in billions of euros)
Lease portfolio
31-12-2015
35.7
31-12-2014
33.0
Capital requirements (in billions of euros)
Regulatory capital
Economic capital
1.7
2.0
1.4
1.5
21%
33%
Number of internal employees (in FTEs)
Number of external employees (in FTEs)
5,402
422
5,217
400
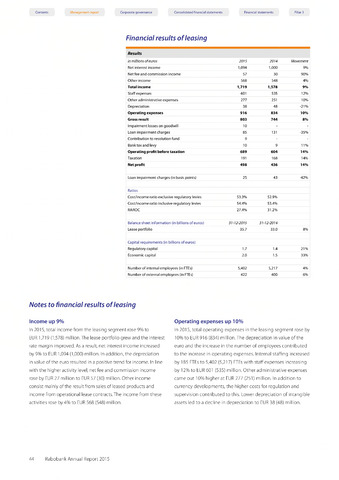
Income up 9%
In 2015, total income from the leasing segment rose 9% to
EUR 1,719 (1,578) million.The lease portfolio grew and the interest
rate margin improved. As a result, net interest income increased
by 9% to EUR 1,094 (1,000) million. In addition, the depreciation
in value of the euro resulted in a positive trend for income. In line
with the higher activity level, net fee and commission income
rose by EUR 27 million to EUR 57 (30) million. Other income
consist mainly of the result from sales of leased products and
income from operational lease contracts.The income from these
activities rose by 4% to EUR 568 (548) million.
Operating expenses up 10%
In 2015, total operating expenses in the leasing segment rose by
10% to EUR 916 (834) million. The depreciation in value of the
euro and the increase in the number of employees contributed
to the increase in operating expenses. Internal staffing increased
by 185 FTEs to 5,402 (5,217) FTEs with staff expenses increasing
by 12% to EUR 601 (535) million. Other administrative expenses
came out 10% higher at EUR 277 (251) million. In addition to
currency developments, the higher costs for regulation and
supervision contributed to this. Lower depreciation of intangible
assets led to a decline in depreciation to EUR 38 (48) million.
44 Rabobank Annual Report 2015