Contents Management report Corporate governance Consolidated financial statements Financial statements Pillar 3
Operating expenses increased by 1%
Staff expenses
Total operating expenses increased by EUR 90 million in 2015
to EUR 8,145 (8,055) million, especially because of an increase in
other administrative expenses. The total number of employees
at Rabobank Group decreased by 2,054 FTEs in 2015 to
51,859 (53,912) FTEs. The decrease was greatest at the local
Rabobanks and at Wholesale, Rural Retail. Staff expenses
fell by 6% to EUR 4,786 (5,086) million in line with the drop
in the number of employees. The decrease in staff expenses
was tempered by upward currency effects at Wholesale, Rural
Retail and DLL. The development in the number of internal
and external employees at Rabobank Group is shown in graph
form above, illustrating the planned additional reduction after
31 December 2015.
Other administrative expenses
Other administrative expenses increased by 15% to
EUR 2,916 (2,532) million. Domestic retail banking saw
an increase in other administrative expenses due to higher
contributions to provisions for reorganisation and legal costs.
In 2014, other administrative expenses fell by EUR 193 million
due to the partial release of a provision previously created for
DSB Bank.The remaining EUR 30 million ofthis provision was
released in 2015.
Depreciation
Higher amortisation of equipment, software and intangible
fixed assets increased the amortisation costs by 1 to
EUR 443 (437) million.
Goodwill impairment
An impairment on goodwill lowered the operating profit
before taxation by EUR 623 (32) million lower. Ofthis sum,
EUR 604 million concern the goodwill impairment for
Rabobank National Association (RNA) in the United States.
More information on this subject can be found in the
explanatory notes to the financial results of the wholesale and
international rural and retail banking business.
Loan impairment charges at 24 basis points
The Rabobank Group's loan impairment charges fell by
EUR 1,600 million to EUR 1,033 (2,633) million in 2015. Relative
to the average loan portfolio, loan impairment charges
amounted to 24 (60) basis points with a long-term average of
36 basis points. The AQR resulted in a charge of EUR 448 million
in 2014.This charge was mainly expressed in the figures for
the domestic retail banking business (the local Rabobanks)
and in the figures for the real estate segment (FGH Bank).
Various sectors benefited from the economic growth and
the accompanying higher consumer spending and exports.
Incidental events and one-off adjustments also caused
a reduction in the loan impairment charges posted by our
divisions. Despite the structural problems in commercial
real estate, greenhouse horticulture and shipping, loan
impairment charges remained limited in these areas as well.
Loan impairment charges also fell at DLL. Wholesale, Rural
Retail was the only area where loan impairment charges
increased
- in part due to delayed cyclical effects. Additional allowances
had to be taken for clients in Latin America and Asia as well as
for several large Dutch clients.
The higher allowances in 2014, as a result of the AQR, were
a reflection of the application of more careful and tighter loss
indicators. In 2015 the findings arising from the AQR were
acted upon.The intention is to embed the use of more careful
and tight loss indicators in regular procedures and information
systems.
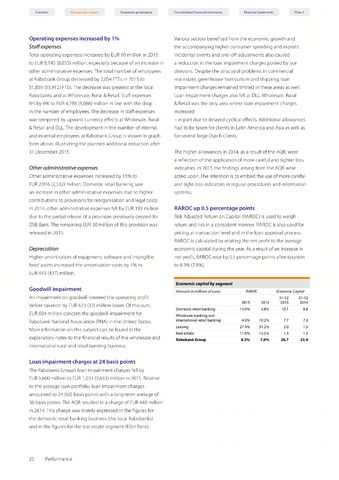
RAROC up 0.5 percentage points
Risk Adjusted Return on Capital (RAROC) is used to weigh
return and risk in a consistent manner. RAROC is also used for
pricing at transaction level and in the loan approval process.
RAROC is calculated by relating the net profit to the average
economic capital during the year. As a result of an increase in
net profit, RAROC rose by 0.5 percentage points after taxation
to 8.3% (7.8%).
Economic capital by segment
Amounts in millions of euros
RAROC
Economic Capital
2015
2014
31-12
2015
31-12
2014
Domestic retail banking
13.0%
5.8%
10.1
8.8
Wholesale banking and
international retail banking
-4.3%
10.2%
7.7
7.3
Leasing
27.4%
31.2%
2.0
1.5
Real estate
11.8%
-15.5%
1.4
1.5
Rabobank Group
8.3%
7.8%
26.7
23.4
25 Performance