10 1
Financial results of Rabobank Group
Contents Management report Corporate governance Consolidated financial statements Financial statements Pillar 3
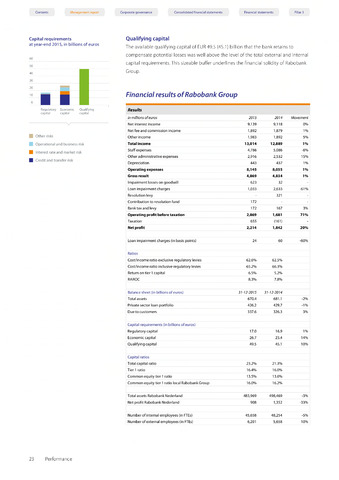
Capital requirements
at year-end 2015, in billions of euros
60
50
40
30
20
Regulatory Economic Qualifying
capital capital capital
I Other risks
Operational and business risk
I Interest rate and market risk
Credit and transfer risk
Qualifying capital
The available qualifying capital of EUR 49.5 (45.1) billion that the bank retains to
compensate potential losses was well above the level of the total external and internal
capital requirements. This sizeable buffer underlines the financial solidity of Rabobank
Group.
Results
in millions of euros
Net interest income
Net fee and commission income
Other income
Total income
Staff expenses
Other administrative expenses
Depreciation
Operating expenses
Gross result
Impairment losses on goodwill
Loan impairment charges
Resolution levy
Contribution to resolution fund
Bank tax and levy
Operating profit before taxation
Taxation
Net profit
2015
9,139
1,892
1,983
13,014
4,786
2,916
443
8,145
4,869
623
1,033
172
172
2,869
655
2,214
2014
9,118
1,879
1,892
12,889
5,086
2,532
437
8,055
4,834
32
2,633
321
167
1,681
(161)
1,842
Movement
1%
1%
1%
1%
71%
20%
Loan impairment charges (in basis points)
Ratios
Cost/income ratio exclusive regulatory levies
Cost/income ratio inclusive regulatory levies
Return on tier 1 capital
RAROC
62.6%
65.2%
6.5%
62.5
66.5
5.1
7.6
Balance sheet (in billions of euros)
Total assets
Private sector loan portfolio
Due to customers
31-12-2015 31-12-2014
670.4 681.1
426.2 429.7
337.6 326.3
Capital requirements (in billions of euros)
Regulatory capital
Economic capital
Qualifying capital
17.0
26.7
49.5
16.9
23.4
45.1
1%
14%
10%
Capital ratios
Total capital ratio
Tier 1 ratio
Common equity tier 1 ratio
Common equity tier 1 ratio local Rabobank Group
23.2%
16.4%
13.5%
16.0%
21.3%
16.0%
13.6%
16.2%
Total assets Rabobank Nederland
Net profit Rabobank Nederland
483,969
908
498,469
1,352
Number of internal employees (in FTEs)
Number of external employees (in FTEs)
45,658
6,201
48,254
5,658
23 Performance