Contents Management report Corporate governance Consolidated financial statements Financial statements Pillar 3
Progress in realisation of financial targets
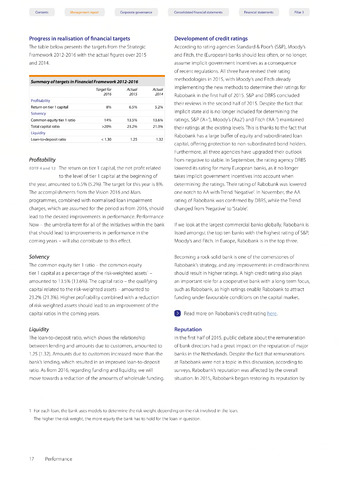
The table below presents the targets from the Strategic
Framework 2012-2016 with the actual figures over 2015
and 2014.
Summary of targets in Financial Framework 2012-2016
Target for
Actual
Actual
2016
2015
2014
Profitability
Return on tier 1 capital
8%
6.5%
5.2%
Solvency
Common equity tier 1 ratio
14%
13.5%
13.6%
Total capital ratio
>20%
23.2%
21.3%
Liquidity
Loan-to-deposit ratio
1.30
1.25
1.32
Profitability
edtf 4and 12 The return on tier 1 capital, the net profit related
to the level of tier 1 capital at the beginning of
the year, amounted to 6.5% (5.2%).The target for this year is 8%.
The accomplishments from the Vision 2016 and Mars
programmes, combined with normalised loan impairment
charges, which are assumed for the period as from 2016, should
lead to the desired improvements in performance. Performance
Now - the umbrella term for all of the initiatives within the bank
that should lead to improvements in performance in the
coming years - will also contribute to this effect.
Solvency
The common equity tier 1 ratio - the common equity
tier 1 capital as a percentage of the risk-weighted assets1 -
amounted to 13.5% (13.6%). The capital ratio - the qualifying
capital related to the risk-weighted assets - amounted to
23.2% (21.3%). Higher profitability combined with a reduction
of risk-weighted assets should lead to an improvement of the
capital ratios in the coming years.
Liquidity
The loan-to-deposit ratio, which shows the relationship
between lending and amounts due to customers, amounted to
1.25 (1.32). Amounts due to customers increased more than the
bank's lending, which resulted in an improved loan-to-deposit
ratio. As from 2016, regarding funding and liquidity, we will
move towards a reduction of the amounts of wholesale funding.
Development of credit ratings
According to rating agencies Standard Poor's (S&P), Moody's
and Fitch, the (European) banks should less often, or no longer,
assume implicit government incentives as a consequence
of recent regulations. All three have revised their rating
methodologies in 2015, with Moody's and Fitch already
implementing the new methods to determine their ratings for
Rabobank in the first half of 2015. S&P and DBRS concluded
their reviews in the second half of 2015. Despite the fact that
implicit state aid is no longer included for determining the
ratings, S&P ('A+'), Moody's ('Aa2') and Fitch ('AA-') maintained
their ratings at the existing levels.This is thanks to the fact that
Rabobank has a large buffer of equity and subordinated loan
capital, offering protection to non-subordinated bond holders.
Furthermore, all three agencies have upgraded their outlook
from negative to stable. In September, the rating agency DRBS
lowered its rating for many European banks, as it no longer
takes implicit government incentives into account when
determining the ratings.Their rating of Rabobank was lowered
one notch to AA with Trend 'Negative'. In November, the AA
rating of Rabobank was confirmed by DBRS, while theTrend
changed from 'Negative'to 'Stable'.
If we look at the largest commercial banks globally, Rabobank is
listed amongst the top ten banks with the highest rating of S&P,
Moody's and Fitch. In Europe, Rabobank is in the top three.
Becoming a rock-solid bank is one of the cornerstones of
Rabobank's strategy, and any improvements in creditworthiness
should result in higher ratings. A high credit rating also plays
an important role for a cooperative bank with a long-term focus,
such as Rabobank, as high ratings enable Rabobank to attract
funding under favourable conditions on the capital market.
O Read more on Rabobank's credit rating here.
Reputation
In the first half of 2015, public debate about the remuneration
of bank directors had a great impact on the reputation of major
banks in the Netherlands. Despite the fact that remunerations
at Rabobank were not a topic in this discussion, according to
surveys, Rabobank's reputation was affected by the overall
situation. In 2015, Rabobank began restoring its reputation by
1 For each loan, the bank uses models to determine the risk weight depending on the risk involved in the loan.
The higher the risk weight, the more equity the bank has to hold for the loan in question.
17 Performance