-
-
-
-
-
-
-
-
-
-
-
-
-
-
-
-
-
-
-
-
-
-
-
-
-
-
-
-
-
-
-
-
Contents Management report Corporate governance Consolidated financial statements Financial statements Pillar 3
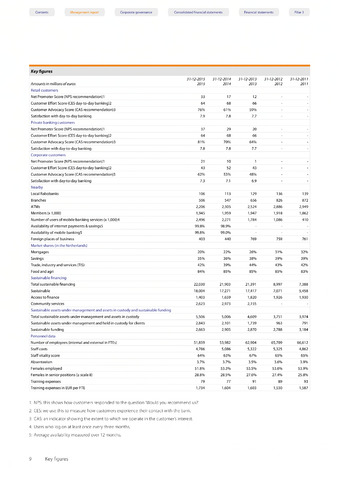
Key figures
Amounts in millions of euros
31-12-2015
2015
31-12-2014
2014
31-12-2013
2013
31-12-2012
2012
31-12-2011
2011
Retail customers
Net Promoter Score (NPS recommendation)1
33
17
12
Customer Effort Score (CES day-to-day banking)2
64
68
66
Customer Advocacy Score (CAS recommendation)3
76%
61%
59%
Satisfaction with day-to-day banking
7.9
7.8
in
Private banking customers
Net Promoter Score (NPS recommendation)1
37
29
20
Customer Effort Score (CES day-to-day banking)2
64
68
66
Customer Advocacy Score (CAS recommendation)3
81%
70%
64%
Satisfaction with day-to-day banking
7.8
7.8
7.7
Corporate customers
Net Promoter Score (NPS recommendation) 1
21
10
1
Customer Effort Score (CES day-to-day banking)2
43
52
43
Customer Advocacy Score (CAS recommendation)3
62%
53%
48%
Satisfaction with day-to-day banking
7.3
7.1
6.9
Nearby
Local Rabobanks
106
113
129
136
139
Branches
506
547
656
826
872
ATMs
2,206
2,305
2,524
2,886
2,949
Members (x 1,000)
1,945
1,959
1,947
1,918
1,862
Number of users of mobile banking services (x 1,000)4
2,496
2,271
1,784
1,086
410
Availability of internet payments savings5
99.8%
98.9%
Availability of mobile banking5
99.8%
99.0%
Foreign places of business
403
440
769
759
761
Market shares (in the Netherlands)
Mortgages
20%
22%
26%
31%
32%
Savings
35%
36%
38%
39%
39%
Trade, industry and services (TIS)
42%
39%
44%
43%
42%
Food and agri 84% 85% 85% 85% 83%
Sustainable financing
Total sustainable financing
22,030
21,903
21,391
8,997
7,388
Sustainable
18,004
17,271
17,417
7,071
5,458
Access to finance
1,403
1,659
1,820
1,926
1,930
Community services
2,623
2,973
2,155
Sustainable assets under management and assets in custody and sustainable funding
Total sustainable assets under management and assets in custody
5,506
5,006
4,609
3,751
3,974
Sustainable assets under management and held in custody for clients
2,843
2,101
1,739
963
791
Sustainable funding
2,663
2,905
2,870
2,788
3,184
Personnel data
Number of employees (internal and external in FTEs)
51,859
53,982
62,904
65,709
66,612
Staff costs
4,786
5,086
5,322
5,325
4,862
Staff vitality score
64%
63%
67%
65%
65%
Absenteeism
3.7%
3.7%
3.5%
3.6%
3.9%
Females employed
51.8%
53.3%
53.5%
53.6%
53.9%
Females in senior positions scale 8)
28.8%
28.5%
27.6%
27.4%
25.8%
Training expenses
79
77
91
89
93
Training expenses in EUR per FTE
1,734
1,604
1,603
1,530
1,587
1NPS: this shows how customers responded to the question 'Would you recommend us?'
2: CES: we use this to measure how customers experience their contact with the bank.
3: CAS: an indicator showing the extent to which we operate in the customer's interest.
4: Users who log on at least once every three months.
5: Average availability measured over 12 months.
9 Key figures