Key figures
-8%
+0.0%-
point
+1.5%-
1 points
-1%
V (2
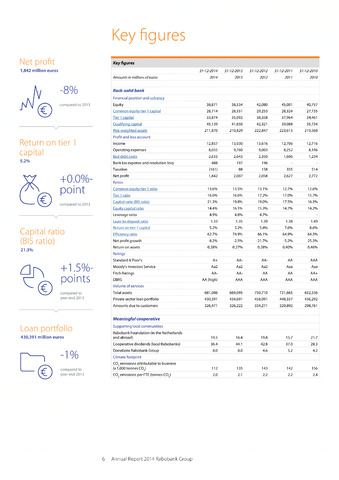
Net profit
Return on tier 1
capital
Capital ratio
(BIS ratio)
Loan portfolio
-
-
-
-
1,842 million euros
compared to 2013
5.2%
compared to 2013
21.3%
compared to
year-end 2013
430,391 million euros
compared to
year-end 2013
Key figures
31-12-2014
31-12-2013
31-12-2012
31-12-2011
31-12-2010
Amounts in millions of euros
2014
2013
2012
2011
2010
Rock-solid bank
Financial position and solvency
Equity
38,871
38,534
42,080
45,001
40,757
Common equitv tier 1 capital
28,714
28,551
29,253
28,324
27,735
Tier 1 caoital
33,874
35,092
38,358
37,964
34,461
Oualifving capital
45,139
41,650
42,321
39,088
35,734
Risk-weiahted assets
211,870
210,829
222,847
223,613
219,568
Profit and loss account
Income
12,857
13,030
13,616
12,706
12,716
Operating expenses
8,055
9,760
9,003
8,252
8,196
Bad debt costs
2,633
2,643
2,350
1,606
1,234
Bank tax expense and resolution levy
488
197
196
Taxation
(161)
88
158
355
514
Net profit
1,842
2,007
2,058
2,627
2,772
Ratios
Common equitv tier 1 ratio
13.6%
13.5%
13.1%
12.7%
12.6%
Tier 1 ratio
16.0%
16.6%
17.2%
17.0%
15.7%
Caoital ratio (BIS ratio)
21.3%
19.8%
19.0%
17.5%
16.3%
Equitv capital ratio
14.4%
16.1%
15.3%
14.7%
14.2%
Leverage ratio
4.9%
4.8%
4.7%
Loan-to-deposit ratio
1.33
1.35
1.39
1.38
1.49
Return on tier 1 capital
5.2%
5.2%
5.4%
7.6%
8.6%
Efficiency ratio
62.7%
74.9%
66.1%
64.9%
64.5%
Net profit growth
-8.2%
-2.5%
-21.7%
-5.2%
25.5%
Return on assets
0.28%
0.27%
0.28%
0.40%
0.46%
Ratings
Standard Poor's
A+
AA-
AA-
AA
AAA
Moody's Investors Service
Aa2
Aa2
Aa2
Aaa
Aaa
Fitch Ratings
AA-
AA-
AA
AA
AA+
DBRS
AA (high)
AAA
AAA
AAA
AAA
Volume of services
Total assets
681,086
669,095
750,710
731,665
652,536
Private sector loan portfolio
430,391
434,691
458,091
448,337
436,292
Amounts due to customers
326,471
326,222
334,271
329,892
298,761
Meaningful cooperative
Supporting local communities
Rabobank Foundation (in the Netherlands
and abroad)
19.5
16.4
19.8
15.7
21.7
Cooperative dividends (local Rabobanks)
36.4
44.1
42.8
37.0
28.3
Donations Rabobank Group
8.0
8.0
4.6
5.2
4.2
Climate footprint
C02 emissions attributable to business
(x 1,000 tonnes C02)
112
135
143
142
156
C02 emissions per FTE (tonnes C02)
2.0
2.1
2.2
2.2
2.4
6 Annual Report 2014 Rabobank Group