Environment
and operations
Climate-neutral operations
Rabobank Group has been climate-neutral since 2007 and
actively aims to reduce the greenhouse gas emissions of its
operations. It adheres to the Greenhouse Gas Protocol
methodology, which involves recording energy consumption,
lease car mileage, business car mileage, business flights, the
use of air conditioning and paper consumption. Our carbon
footprint for 2012 was more or less the same as in 2011,
both in absolute terms and in emissions per FTE. Carbon
emissions produced by our operations are offset by
purchasing VCS-certified carbon credits issued by wind
energy projects in India. Thanks to this, Rabobank Group's
operations were climate-neutral in 2012.
Carbon footprint
Long-term trends
Financing green electricity
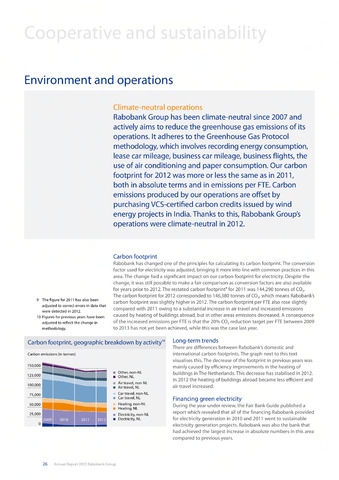
Carbon footprint, geographic breakdown by activity10
Rabobank has changed one of the principles for calculating its carbon footprint. The conversion
factor used for electricity was adjusted, bringing it more into line with common practices in this
area. The change had a significant impact on our carbon footprint for electricity. Despite the
change, it was still possible to make a fair comparison as conversion factors are also available
for years prior to 2012. The restated carbon footprint9 for 2011 was 144,290 tonnes of C02.
The carbon footprint for 2012 corresponded to 146,380 tonnes of C02, which means Rabobank's
carbon footprint was slightly higher in 2012. The carbon footprint per FTE also rose slightly
compared with 2011 owing to a substantial increase in air travel and increased emissions
caused by heating of buildings abroad, but in other areas emissions decreased. A consequence
of the increased emissions per FTE is that the 20% C02 reduction target per FTE between 2009
to 2013 has not yet been achieved, while this was the case last year.
There are differences between Rabobank's domestic and
international carbon footprints. The graph next to this text
visualises this. The decrease of the footprint in previous years was
mainly caused by efficiency improvements in the heating of
buildings in The Netherlands. This decrease has stabilised in 2012.
In 2012 the heating of buildings abroad became less efficient and
air travel increased.
During the year under review, the Fair Bank Guide published a
report which revealed that all of the financing Rabobank provided
for electricity generation in 2010 and 2011 went to sustainable
electricity generation projects. Rabobank was also the bank that
had achieved the largest increase in absolute numbers in this area
compared to previous years.
26 Annual Report 2012 Rabobank Group
9 The figure for 2011 has also been
adjusted to correct errors in data that
were detected in 2012.
10 Figures for previous years have been
adjusted to reflect the change in
methodology.
Carbon emissions (in tonnes)
150,000
1 111 Other, non-NL
!2.5:0.0.0. 0ther'NL
100,000 I Air travel, non-NL
75 goo ^-ar trave'' non-NL
50,000 Heating, non-NL
Heating, NL
25,000 Electricity, non-NL
Electricity, NL
0