Financial results of wholesale banking and
international retail banking
Notes to financial results of wholesale banking
and international retail banking
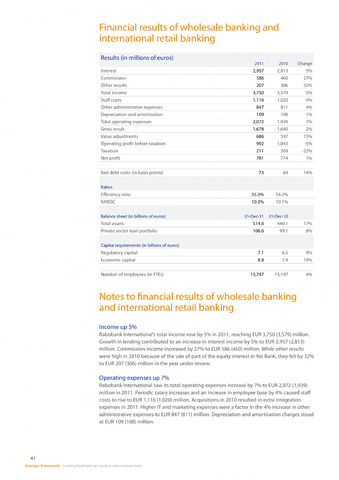
Results (in millions of euros)
Interest
2011
2,957
2010
2,813
Change
5%
Commission
586
460
27%
Other results
207
306
-32%
Total income
3,750
3,579
5%
Staff costs
1,116
1,020
9%
Other administrative expenses
847
811
4%
Depreciation and amortisation
109
108
1%
Total operating expenses
2,072
1,939
7%
Gross result
1,678
1,640
2%
Value adjustments
686
597
15%
Operating profit before taxation
992
1,043
-5%
Taxation
211
269
-22%
Net profit
781
774
1%
Bad debt costs (in basis points)
73
64
14%
Ratios
Efficiency ratio
55.3%
54.2%
RAROC
10.3%
10.1%
Balance sheet (in billions of euros)
Total assets
31-Dec-11
514.6
31-Dec-10
440.1
17%
Private sector loan portfolio
106.6
99.1
8%
Capital requirements (in billions of euros)
Regulatory capital
7.1
6.5
9%
Economic capital
8.8
7.4
19%
Number of employees (in FTEs)
15,747
15,197
4%
Income up 5%
Rabobank International's total income rose by 5% in 2011reaching EUR 3,750 (3,579) million.
Growth in lending contributed to an increase in interest income by 5% to EUR 2,957 (2,813)
million. Commission income increased by 27% to EUR 586 (460) million. While other results
were high in 2010 because of the sale of part of the equity interest in Yes Bank, they fell by 32%
to EUR 207 (306) million in the year under review.
Operating expenses up 7%
Rabobank International saw its total operating expenses increase by 7% to EUR 2,072 (1,939)
million in 2011Periodic salary increases and an increase in employee base by 4% caused staff
costs to rise to EUR 1,116 (1,020) million. Acquisitions in 2010 resulted in extra integration
expenses in 2011. Higher IT and marketing expenses were a factor in the 4% increase in other
administrative expenses to EUR 847 (811) million. Depreciation and amortisation charges stood
at EUR 109 (108) million.
41
Strategic Framework Leading food and agri bank at international level