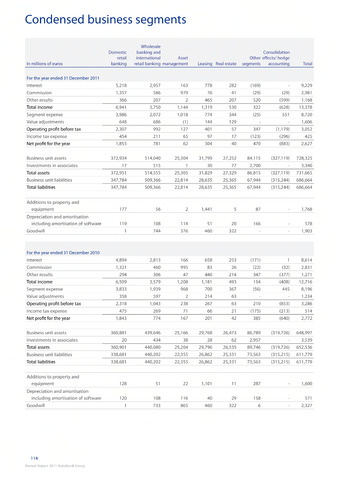
Condensed business segments
-
-
-
-
-
-
-
-
-
-
In millions of euros
Domestic
retail
banking
Wholesale
banking and
international Asset
retail banking management
Leasing
Real estate
Consolidation
Other effects/ hedge
segments accounting
Total
For the year ended 31 December 2011
Interest
5,218
2,957
163
778
282
(169)
9,229
Commission
1,357
586
979
76
41
(29)
(29)
2,981
Other results
366
207
2
465
207
520
(599)
1,168
Total income
6,941
3,750
1,144
1,319
530
322
(628)
13,378
Segment expense
3,986
2,072
1,018
774
344
(25)
551
8,720
Value adjustments
648
686
(1)
144
129
1,606
Operating profit before tax
2,307
992
127
401
57
347
(1,179)
3,052
Income tax expense
454
211
65
97
17
(123)
(296)
425
Net profit for the year
1,853
781
62
304
40
470
(883)
2,627
Business unit assets
372,934
514,040
25,304
31,799
27,252
84,115
(327,119)
728,325
Investments in associates
17
515
1
30
77
2,700
3,340
Total assets
372,951
514,555
25,305
31,829
27,329
86,815
(327,1 19)
731,665
Business unit liabilities
347,784
509,366
22,814
28,635
25,365
67,944
(315,244)
686,664
Total liabilities
347,784
509,366
22,814
28,635
25,365
67,944
(315,244)
686,664
Additions to property and
equipment
177
56
2
1,441
5
87
1,768
Depreciation and amortisation
including amortisation of software
119
108
114
51
20
166
578
Goodwill
1
744
376
460
322
1,903
For the year ended 31 December 2010
Interest
4,894
2,813
166
658
253
(171)
1
8,614
Commission
1,321
460
995
83
26
(22)
(32)
2,831
Other results
294
306
47
440
214
347
(377)
1,271
Total income
6,509
3,579
1,208
1,181
493
154
(408)
12,716
Segment expense
3,833
1,939
968
700
367
(56)
445
8,196
Value adjustments
358
597
2
214
63
1,234
Operating profit before tax
2,318
1,043
238
267
63
210
(853)
3,286
Income tax expense
475
269
71
66
21
(175)
(213)
514
Net profit for the year
1,843
774
167
201
42
385
(640)
2,772
Business unit assets
360,881
439,646
25,166
29,768
26,473
86,789
(319,726)
648,997
Investments in associates
20
434
38
28
62
2,957
3,539
Total assets
360,901
440,080
25,204
29,796
26,535
89,746
(319,726)
652,536
Business unit liabilities
338,681
440,202
22,355
26,862
25,331
73,563
(315,215)
611,779
Total liabilities
338,681
440,202
22,355
26,862
25,331
73,563
(315,215)
611,779
Additions to property and
equipment
128
51
22
1,101
11
287
1,600
Depreciation and amortisation
including amortisation of software
120
108
116
40
29
158
571
Goodwill
1
733
805
460
322
6
2,327
114
Annual Report 2011 Rabobank Group