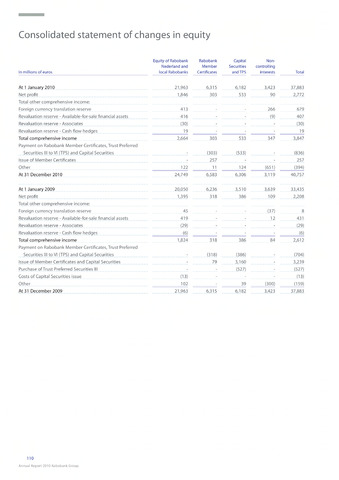
Consolidated statement of changes in equity
Equity of Rabobank Rabobank Capital Non-
Nederland and Member Securities controlling
In millions of euros local Rabobanks Certificates and TPS interests Total
At 1 January 2010 21,963 6,315 6,182 3,423 37,883
Net profit 1,846 303 533 90 2,772
Total other comprehensive income;
Foreign currency translation reserve 413 - - 266 679
Revaluation reserve- Ayailable-for-sale financial assets 416 - - (9) 407
Revaluation reserve- Associates (30) - - - (30)
Revaluation reserve- Cash flow hedges 19 - - - 19
Total comprehensive income 2.664 303 533 347 3.847
Payment on Rabobank Member Certificates, Trust Preferred
Securities III to VI (TPS) and Capital Securities - (303) (533) - (836)
Issue of Member Certificates - 257 - - 257
Other 122 11 124 (651) (394)
At 31 December 2010 24,749 6,583 6,306 3,119 40,757
At 1 January 2009 20,050 6,236 3,510 3,639 33,435
Net profit 1,395 318 386 109 2,208
Total other comprehensive income;
Foreign currency translation reserve 45 - - (37) 8
Revaluation reserve- Available-for-sale financial assets 419 - - 12 431
Revaluation reserve- Associates (29) - - - (29)
Revaluation reserve- Cash flow hedges (6) - - - (6)
Total comprehensive income 1.824 318 386 84 2,612
Payment on Rabobank Member Certificates, Trust Preferred
Securities III to VI (TPS) and Capital Securities - (318) (386) - (704)
Issue of Member Certificates and Capital Securities - 79 3,160 - 3,239
Purchase of Trust Preferred Securities III - - (527) - (527)
Costs of Capital Securities issue (13) - - - (13)
Other 102 39 (300) (159)
At 31 December 2009 21,963 6,315 6,182 3,423 37,883
110
Annual Report 2010 Rabobank Group