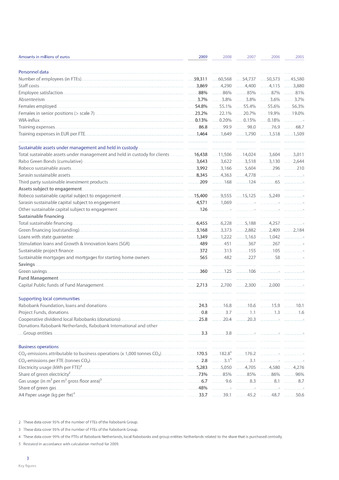
Amounts in millions of euros
2009
2008
2007
2006
2005
Personnel data
Number of employees (in PTEs)
Staff costs
Employee, satisfaction
Absenteeism
remales employed
Females, in senior positions. scale .7)
WIA-in.flux
Training, expenses
Training expenses in EUR per ETE
Sustainable assets under managementand held in custody
Total sustainable assets under management and held in custody for clients
Rabo. Green Bonds (cumulative)
Robe.co.sustainable assets.
Sarasinsustainable assets
Third, party, sustainable investment products
Assets subject to engagement
Robeco sustainable capital subject to engagement
Sarasin. sustainable capital subject to engagement
Other.sustainable.capital.subject to engagement
Sustainable financing
Total sustainable financing
Green financing (outstanding).
Loans with state guarantee
Stimulation loans and Growth Innovation loans (SGR)
Sustainable project finance
Sustainable mortgages and mortgages for starting home owners
Savings
Green savings
Fund Management
Capital Public funds of Fund Management
Supporting local communities
Rabobank Foundation, loans and donations
Project Funds, donations
Cooperative.div.ide.nd.local Rabobanks (donations)
Donations Rabobank Netherlands, Rabobank International and other
Group entities
Business operations
CO,-emissions attributable to business operations, (x. 1,000.tonnes.C0.2i
CO,-emissions per TTE (tonnes CO,)
Flectric.ity usage (kWh per ETE)2
Share of greenel.ectrici.ty2
Gas usage (in m3 per m2 gross floor area)'
Share of green gas
A4 Paper usage (kg per fte)4
59,311
60,568
54,737
50,5.73
45,580
3,869
4,290
4,400
4,115
3,880
88%
86%
85%
8.7%
81%
3.7%
3.8%
3.8%
3.6%
3.7%
54.8%
55.1%
55.4%
55.6%
5.6.3%
23.2%
22.1
20.7%
19.9%
19.0%
0.13%
0.20%
0.15%
0.18%
86.8
99.9
98.0.
.7.6.9
68.7.
1,464
1,649
1,790
1,518
1,5.09
16,438 1.1,5.06 14,024 3,604 3,011
3,643 3,6.22 3,518 3,130 2,644.
3,992 3,166 5,604.
4,3.63 4,778
124
.296.
21.0.
8,345
209
168
15,400 9,555 15,125
65
.5,249.
4,571
126
.1,0.69
6,455
6,228
5,188
4,257
3,168
3,373.
2,882
2,409
1,349
1,222
1,163
1,042
489
45.1
3.67.
267.
372
3.13.
155
105
565
482
227
58
360
125.
.106.
2,713 2,7.00. 2,3.00. 2,000.
24.3
0.8
25.8
3.3
.16.8
3.7
.20.4
3.8
10.6.
1.1
20.3
15.9
1.3
10.1
1.6
170.5
182.8s
1.7.6.2
2.8
3.1s
3.1
5,283
5,050
4,705
4,580
4,276
73%
85%
85%
86%
96%
6.7
9.6
8.3
8.1
8.7
48%
33.7
39.1
45.2
48.7
50.6
2 These data cover 95% of the number of FTEs of the Rabobank Group.
3 These data cover 95% of the number of FTEs of the Rabobank Group.
4 These data cover 99% of the FTEs of Rabobank Netherlands, local Rabobanks and group entities Netherlands related to the share that is purchased centrally.
5 Restated in accordance with calculation method for 2009.
3
Key figures