Key figures
200 m I
loo 1 Bi 1 1
I
I I
"I
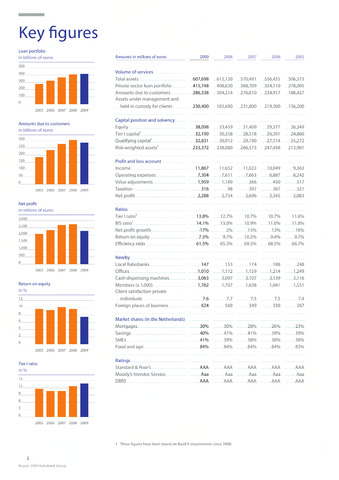
Loan portfolio
in billions of euros
500
400
300M
o
2005 2006 2007 2008 2009
Amounts due to customers
in billions of euros
300
200
150
50
2005 2006 2007 2008 2009
Net profit
in milions of euros
3.000
2.500
2,000
1,500
1,000
500
0
2005 2006 2007 2008 2009
Return on equity
in
10
8
6
4
2
0
2005 2006 2007 2008 2009
Tier I ratio
in
12
I
9
6
3
0
Amounts in millions of euros
Volume, of services
Total assets
Private sector loan portfolio
Amounts due.to. customers
Assets under management and
held in custody.for clients
Capital position and solvency
Equity
Tier I capital
Qualifying capital1
Risk-.weighted assets
Profit and loss account
Income
Operating expenses.
Value.adjustments.
Taxation
Net profit
Ratios
Tier I ratio
BIS ratio.1
Net profit growth..
Return on equity
Efficiency ratio
Nearby
Local Rabobanks
Offices
Cash-dispensing machines.
Members (x 1,000)
Client satisfaction private
individuals
Foreign, places of business
Ratings
Standard Poor's
Moody'sI nvestor. Service
DBRS
2009
Market shares (in the Netherlands).
Mortgages
Savings
SMEs
Food. and.agri
2008
2007
2006
2005
607,698
415,748
286,338
61.2,1.20.
408,620
.304,214
570,491
368,709
276,61.0
556,455.
324,110
234,917
506,573
278,095
186,427
230,400 183,600 .231,800 219,300 156,200
38,098 33,459
31,409 29,377 26,349
32,190 30,358 28,518 26,39.124.860
32,831 30,912 29,19.0 27,114. 25,272
233,372 238,080. .266,573 .247,458 213,901
11,867 1.1,652
7,304
1,959
316
.7,61.1
.1,1.89
98
11,022 10,049 9,363.
7,663 6,88.76,242
.450. 517
367 521
2,288 2,7.54.
26.6
397
2,69.6
2,345 2,083
13.8%
12.7%
10.7%
10,7%
1,1,6%
14.1%
13.0%
10,9%
,1.1,0%
11,8%
-17%
2%
15%
.13%
1.6%
7.5%
9.7%
10,2%
9,4%
9,7%
61.5%
65.3%
69,5%
68,5%
66,7%
147
153.
174
188
1,010 1,112
1,1.59 1,214
3,063
1,762
.3,097
3,1.07
1,707 1,638
3,139
1,641
7.6
624
...7.7
.5.69.
7.5
.349.
248
1,249
3,116
.1,551
.7.5.
330
7.4
.26.7.
30%
3.0%
28%
40%
41%
.4.1%
41%
3.9%
3.8%
84%
.84%
.8.4%
AAA
AAA
AAA
Aaa
Aaa
Aaa
AAA
AAA
AAA
2.6%
.3.9%
.3.8%
8.4%
23%
.3.9%
3.8%
83%
AAA
Aaa
AAA
AAA
Aaa
AAA
2005 2006 2007 2008 2009
1 These figures have been based on Basel II requirements since 2008.
2
Report 2009 Rabobank Group