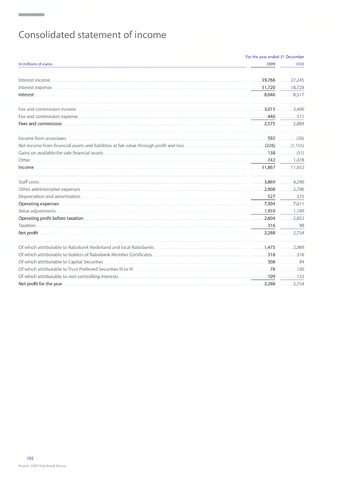
Consolidated statement of income
For the year ended 31 December
In millions of euros 2009 2008
Interest income
Interest, expense..
Interest
Fee and commission.income.
Fee.and commission.expense
Fees and commission
Staff costs
Other administrative expenses
Depreciation and amortisation
Operating expenses
Value adjustments
Operating profit before taxation
Taxation
Income, from associates
Net income from financial assets and liabilities at fair value through profit and loss
Gains on available-for-salo financial assets
Other
Income
19,766
27,245
11,720
18,728
8,046
8,517
3,015
3,400
440
51.1.
2,575
2.889
592
(.26)
(226)
(1,155)
138
(5.1).
742
1,478
11,867
1.1,652
3,869
4,290
2,908
2,796
527
525
7,304
7,611
1,959
1,189
2,604
2,852
316
98
Net profit2,288 2,754
Of which attributable, to Rabobank Nederland and local Rabobanks1,475 2,089.
Of which attributable to holders of Rabobank Member Certificates318 316.
Of which attributable to Capital Securities308 94.
Of which attributable to Trust Preferred Securities III to VI78 1.00.
Of which attributable to non-controlling interests109 1.55.
Net profit for the year 2,288 2,754
102
Report 2009 Rabobank Group