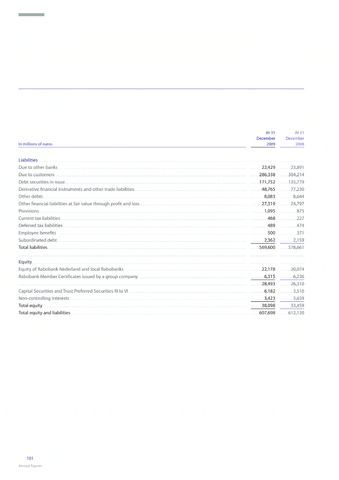
In millions of euros
At 31
December
2009
At 31
December
2008
Liabilities
Due to other banks
Due to customers
Debt securities in issue
Derivative.financiaIinstruments and other trade lia bilities
Other debts
Other.financial liabilities at.fair.value, through.profit. and.loss.
Provisions
Current tax. liabilities
Deferred tax Iiabilities
Employeebenefits
Subordinated debt
Total liabilities
Equity
Equity of Rabobank Nederland and local Rabobanks
Rabobank Member.Certificates, issued.by.a.group company
Capital Securities and Trust Preferred Securities III to VI
Non-controlling interests
Total equity
Total equity and liabilities
101
Annual figures
22,429 23,891
286,338 304,214.
171,752 135,779
48,765 77,230
8,083 8,644
27,319 24,797
1,095 .875.
468 227
489 474.
500 371
2,362 2,159
569,600 578,661
22,178 20,074.
6,315 6,236.
28,493 26,310
6,182 3,510
3,423 3,639
38,098 33,459.
607,698 612,120