Key figures
.ll
loo BIB11
I I
I
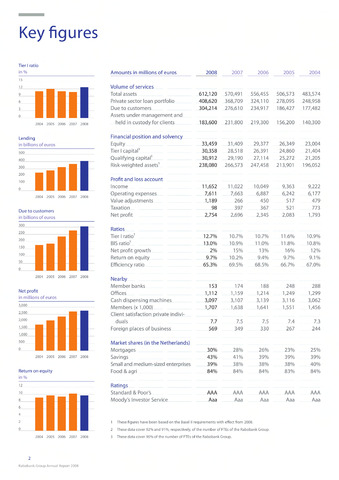
Tier I ratio
in
15
12
2004 2005 2006 2007 2008
Lending
in billions of euros
500
400
300H H
2004 2005 2006 2007 2008
Due to customers
in billions of euros
300
150
50
2004 2005 2006 2007 2008
Net profit
in millions of euros
3,000
2,500
2,000
1,500
1,000
500
2004 2005 2006 2007 2008
Return on equity
in
12
2004 2005 2006 2007 2008
1 These figures have been based on the Basel II requirements with effect from 2008.
2 These data cover 92% and 91%, respectively, of the number of FTEs of the Rabobank Group.
3 These data cover 90% of the number of FTEs of the Rabobank Group.
Amounts in millions of euros
2008
2007
2006
2005
2004
Volume of services
Total assets
612,120
570,491
556,455
506,573
483,574
Private sector loan portfolio
408,620
368,709
324,110
278,095
248,958
Due to customers
304,214
276,610
234,917
186,427
177,482
Assets under management and
held in custody for clients
183,600
231,800
219,300
156,200
140,300
Financial position and solvency
Equity
33,459
31,409
29,377
26,349
23,004
Tier I capital1
30,358
28,518
26,391
24,860
21,404
Qualifying capital1
30,912
29,190
27,114
25,272
21,205
Risk-weighted assets1
238,080
266,573
247,458
213,901
196,052
Profit and loss account
Income
11,652
11,022
10,049
9,363
9,222
Operating expenses
7,611
7,663
6,887
6,242
6,177
Value adjustments
1,189
266
450
517
479
Taxation
98
397
367
521
773
Net profit
2,754
2,696
2,345
2,083
1,793
Ratios
Tier 1 ratio1
12.7%
10.7%
10.7%
11.6%
10.9%
BIS ratio1
13.0%
10,9%
11.0%
11.8%
10.8%
Net profit growth
2%
15%
13%
16%
12%
Return on equity
9.7%
10.2%
9.4%
9.7%
9.1%
Efficiency ratio
65.3%
69.5%
68.5%
66.7%
67.0%
Nearby
Member banks
153
174
188
248
288
Offices
1,112
1,159
1,214
1,249
1,299
Cash dispensing machines
3,097
3,107
3,139
3,116
3,062
Members (x 1,000)
1,707
1,638
1,641
1,551
1,456
Client satisfaction private indivi
duals
7.7
7.5
7.5
7.4
7.3
Foreign places of business
569
349
330
267
244
Market shares (in the Netherlands)
Mortgages
30%
28%
26%
23%
25%
Savings
43%
41
39%
39%
39%
Small and medium-sized enterprises
39%
38%
38%
38%
40%
Food agri
84%
84%
84%
83%
84%
Ratings
Standard Poor's
AAA
AAA
AAA
AAA
AAA
Moody's Investor Service
Aaa
Aaa
Aaa
Aaa
Aaa
2
Rabobank Group Annual Report 2008