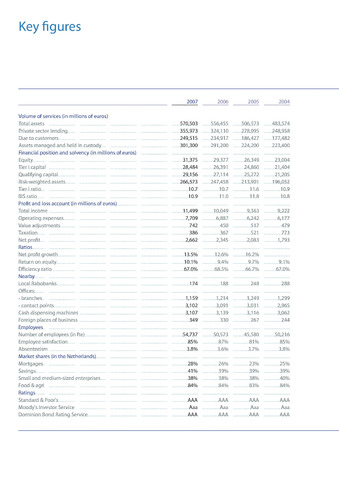
Key figures
2007 2006
570,503 ...55.6,455.
355,973 ...32.4,1.10.
249,515 ...234,9.17.
301,300 ...29.1,200.
506,573 483,574
278,095 248,958
186,427 177,482
224,200 223,400
9,363 9,222
6,242 6,177
517 479
521 773
2,083 1,793
1,249 1,299
3,031 2,965
3,116 3,062
267 244
Volume of services (in millions of euros)
Total assets
Private sector lending
Due to customers
Assets managed and held in custody
Financial position and solvency (in millions of euros)
Equity
Tier I capital
Qualifying capital
Risk-weighted assets
Tier I ratio
BIS ratio
Profit and loss account (in millions of euros)
Total income
Operating expenses
Value adjustments
Taxation
Net profit
Ratios
Net profit growth
Return on equity
Efficiency ratio
Nearby
Local Rabobanks
Offices:
- branches
- contact points
Cash dispensing machines
Foreign places of business
Employees
Number of employees (in fte)
Employee satisfaction
Absenteeism
Market shares (in the Netherlands)
Mortgages
Savings
Small and medium-sized enterprises
Food agri
Ratings
Standard Poor's
Moody's Investor Service
Dominion Bond Rating Service
31,375 2.9,377.
28,484 2.6,391
29,156 27,114
266,573 ...247,458
10.7 10.7
10.9 11.0.
11,499 .....1.0,049
7,709 6,887
742 450.
386 367.
2,662 2,345.
13.5% 12.6%.
10.1% 9.4%,
67.0% ....68.5%.
174 188
1,159 1,214
3,102 3,091.
3,107 3,139.
54,737
50,573
85%
87%
3.8%
3.6%
28%
26%
41%
39%
38%
38%
84%
84%
AAA
AAA
Aaa
Aaa
AAA AAA
2005 2004
26,349 23,004
24,860 21,404
25,272 21,205
213,901 196,052
11.6 10.9
11.8 10.8
16.2%
9.7% 9.1%
66.7% 67.0%
248 288
45,580 50,216
81% 85%
3.7% 3.8%
23%
25%
39%
39%
38% 40%
83% 84%
AAA AAA
Aaa Aaa
AAA AAA