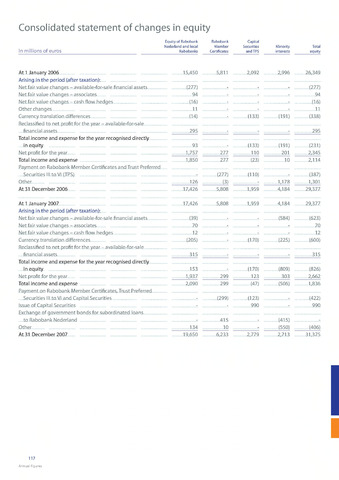
Consolidated statement of changes in equity
93 - (133) (191) (231)
1,757 277 110 201 2,345
1,850 277 (23) 10 2,114
1,937 299 123 303 2,662
2,090 299 (47) (506) 1,836
(299) (123) - (422)
- 990 - 990
- 415 - (415) -
In millions of euros
At 1 January 2006
Arising in the period (after taxation):
Net fair value changes - available-for-sale financial assets
Net fair value changes - associates
Net fair value changes - cash flow hedges
Other changes
Currency translation differences
Reclassified to net profit for the year - available-for-sale
financial assets
Total income and expense for the year recognised directly
in equity
Net profit for the year
Total income and expense
Payment on Rabobank Member Certificates and Trust Preferred
Securities III to VI (TPS)
Other
At 31 December 2006
At 1 January 2007
Arising in the period (after taxation):
Net fair value changes - available-for-sale financial assets
Net fair value changes - associates
Net fair value changes - cash flow hedges
Currency translation differences
Reclassified to net profit for the year - available-for-sale
financial assets
Total income and expense for the year recognised directly
in equity
Net profit for the year
Total income and expense
Payment on Rabobank Member Certificates, Trust Preferred
Securities III to VI and Capital Securities
Issue of Capital Securities
Exchange of government bonds for subordinated loans
to Rabobank Nederland
Other
At 31 December 2007
Equity of Rabobank Rabobank Capital
Nederland and local Member Securities Minority Total
Rabobanks Certificates and TPS interests equity
15,450 5,811 2,092 2,996 26,349
(277) - - - (277)
94 - - - 94
(16) - - - (16)
11 - - - 11
(14) - (133) (191) (338)
295 - - - 295
- (277) (1 10) - (387)
126 (3) - 1,178 1,301
17,426 5,808 1,959 4,184 29,377
17,426 5,808 1,959 4,184 29,377
(39) - - (584) (623)
70 - - - 70
12 - - - 12
(205) - (170) (225) (600)
315 - - - 315
153 - (170) (809) (826)
134 10 - (550) (406)
19,650 6,233 2,779 2,713 31,375
117
Annual figures