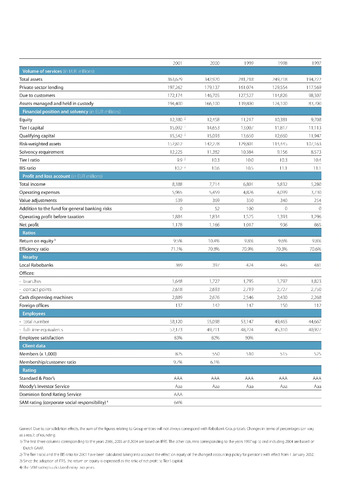
2001
2000
1999
1998
1997
Volume of services (in EUR millions)
Total assets
363,679
342,920
281,218
249,718
194,222
Private sector lending
197,262
179,137
161,074
129,554
117,569
Due to customers
172,174
146,705
127,527
114,826
98,307
Assets managed and held in custody
194,400
166,100
139,800
124,100
83,700
Financial position and solvency (in EUR millions)
Equity
12,380 2
12,458
11,217
10,381
9,708
Tier I capital
15,092 2
14,653
13,007
11,817
11,113
Qualifying capital
15,542 2
15,093
13,650
12,660
11,947
Risk-weighted assets
152,812
142,278
129,801
114,445
107,163
Solvency requirement
12,225
11,382
10,384
9,156
8,573
Tier I ratio
9.9 2
10.3
10.0
10.3
10.4
BIS ratio
10.2 2
10.6
10.5
11.1
11.1
Profit and loss account (in EUR millions)
Total income
8,388
7,714
6,801
5,832
5,280
Operating expenses
5,965
5,459
4,826
4,099
3,730
Value adjustments
539
369
350
340
254
Addition to the fund for general banking risks
0
52
100
0
0
Operating profit before taxation
1,884
1,834
1,525
1,393
1,296
Net profit
1,178
1,166
1,017
936
865
Ratios
Return on equity 3
9.5%
10.4%
9.8%
9.6%
9.8%
Efficiency ratio
71.1%
70.8%
70.9%
70.3%
70.6%
Nearby
Local Rabobanks
369
397
424
445
481
Offices:
- branches
1 ,648
1,727
1,795
1,797
1,823
- contact points
2,618
2,693
2,719
2,727
2,750
Cash dispensing machines
2,889
2,676
2,546
2,430
2,268
Foreign offices
137
142
147
150
112
Employees
- total number
58,120
55,098
53,147
49,465
44,667
- full-time equivalents
52,173
49,711
48,224
45,310
40,927
Employee satisfaction
83%
82%
80%
Client data
Members (x 1,000)
825
550
510
515
525
Membership/customer ratio
9.7%
6.1%
Rating
Standard Poor's
AAA
AAA
AAA
AAA
AAA
Moody's Investor Service
Aaa
Aaa
Aaa
Aaa
Aaa
Dominion Bond Rating Service
AAA
SAM rating (corporate social responsibility) 4
64%
General: Due to consolidation effects, the sum of the figures relating to Group entities will not always correspond with Rabobank Group totals. Changes in terms of percentages can vary
as a result of rounding.
1) The first three columns corresponding to the years 2006, 2005 and 2004 are based on IFRS. The other columns corresponding to the years 1997 up to and including 2004 are based on
Dutch GAAP.
2) The Tier I ratio and the BIS ratio for 2001 have been calculated taking into account the effect on equity of the changed accounting policy for pensions with effect from 1 January 2002.
3) Since the adoption of IFRS, the return on equity is expressed as the ratio of net profit to Tier I capital.
4) The SAM rating is calculated every two years.