in
In
11
fn
1
0 1
j
5 Rabobank Group Annual Report 2005
Key figures
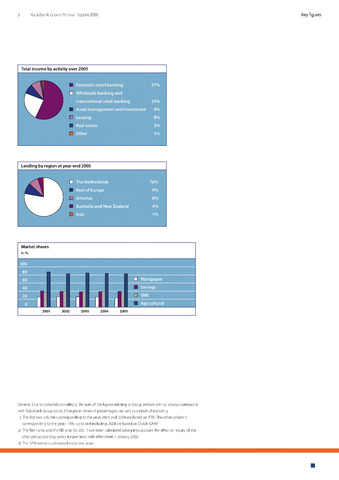
Total income by activity over 2005
Domestic retail banking
Wholesale banking and
international retail banking
Asset management and investment
Leasing
Real estate
Lending by region at year-end 2005
The Netherlands
Rest of Europe
America
Australia and New Zealand
Market shares
in
100
80
60
Mortgages
40
Savings
20
SME
Agricultural
2001
2002
2003
2004
2005
General: Due to consolidation effects, the sum of the figures relating to Group entities will not always corresponc
with Rabobank Group totals. Changes in terms of percentages can vary as a result of rounding.
1) The first two columns corresponding to the years 2005 and 2004 are based on IFRS. The other columns
corresponding to the years 1996 up to and including 2004 are based on Dutch GAAP
2) The Tier I ratio and the BIS ratio for 2001 have been calculated taking into account the effect on equity of the
changed accounting policy for pensions with effect from 1 January 2002.
3) The SAM-rating is calculated every two years.