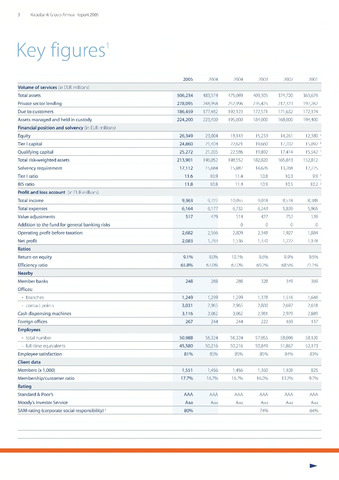
Key figures1
3 Rabobank Group Annual Report 2005
2005
2004
2004
2003
2002
2001
Volume of services (in EUR millions)
Total assets
506,234
483,574
475,089
403,305
374,720
363,679
Private sector lending
278,095
248,958
252,996
235,425
212,323
197,262
Due to customers
186,459
177,482
192,123
172,571
171,632
172,174
Assets managed and held in custody
224,200
223,400
195,000
184,000
168,000
194,400
Financial position and solvency (in EUR millions)
Equity
26,349
23,004
18,143
15,233
14,261
12,380 2
Tier I capital
24,860
21,404
22,621
19,660
17,202
15,092 2
Qualifying capital
25,272
21,205
22,586
19,892
17,414
15,542 2
Total risk-weighted assets
213,901
196,052
198,552
182,820
165,843
152,812
Solvency requirement
17,112
15,684
15,887
14,626
13,268
12,225
Tier I ratio
11.6
10.9
11.4
10.8
10.3
9.9 2
BIS ratio
11.8
10.8
11.4
10.9
10.5
10.2 2
Profit and loss account (in EUR millions)
Total income
9,363
9,222
10,055
9,018
8,518
8,388
Total expenses
6,164
6,177
6,732
6,243
5,839
5,965
Value adjustments
517
479
514
427
752
539
Addition to the fund for general banking risks
0
0
0
0
Operating profit before taxation
2,682
2,566
2,809
2,348
1,927
1,884
Net profit
2,083
1,793
1,536
1,370
1,222
1,178
Ratios
Return on equity
9.1%
9.0%
10.1%
9.6%
9.9%
9.5%
Efficiency ratio
65.8%
67.0%
67.0%
69.2%
68.5%
71.1%
Nearby
Member banks
248
288
288
328
349
369
Offices:
- branches
1,249
1,299
1,299
1,378
1,516
1,648
- contact points
3,031
2,965
2,965
2,800
2,697
2,618
Cash dispensing machines
3,116
3,062
3,062
2,981
2,979
2,889
Foreign offices
267
244
244
222
169
137
Employees
- total number
50,988
56,324
56,324
57,055
58,096
58,120
- full-time equivalents
45,580
50,216
50,216
50,849
51,867
52,173
Employee satisfaction
81%
85%
85%
85%
84%
83%
Client data
Members (x 1,000)
1,551
1,456
1,456
1,360
1,108
825
Membership/customer ratio
17.7%
16.7%
16.7%
16.0%
13.2%
9.7%
Rating
Standard Poor's
AAA
AAA
AAA
AAA
AAA
AAA
Moody's Investor Service
Aaa
Aaa
Aaa
Aaa
Aaa
Aaa
SAM-rating (corporate social responsibility) 3
80%
74%
64%