1
I
I
I
1
l
l
o 1
1
10 I
a 1
5 Rabobank Group Annual Report 2004
Key figures
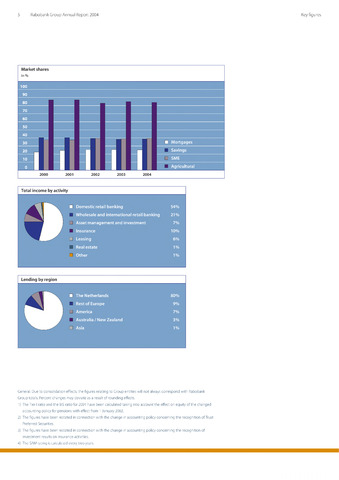
Market shares
in
100
90
80
70
60
50
40
30
Mortgages
20
Savings
SME
Agricultural
2000 2001 2002 2003 2004
Total income by activity
Domestic retail banking
54%
Wholesale and international retail banking
21%
Asset management and investment
7%
Insurance
10%
Leasing
6%
Real estate
1%
Other
1%
Lending by region
The Netherlands
80%
Rest of Europe
9%
America
7%
Australia New Zealand
3%
Asia
1%
General: Due to consolidation effects, the figures relating to Group entities will not always correspond with Rabobank
Group totals. Percent changes may deviate as a result of rounding effects.
1) The Tier I ratio and the BIS ratio for 2001 have been calculated taking into account the effect on equity of the changed
accounting policy for pensions with effect from 1 January 2002.
2) The figures have been restated in connection with the change in accounting policy concerning the recognition of Trust
Preferred Securities.
3) The figures have been restated in connection with the change in accounting policy concerning the recognition of
investment results on insurance activities.
4) The SAM rating is calculated every two years.