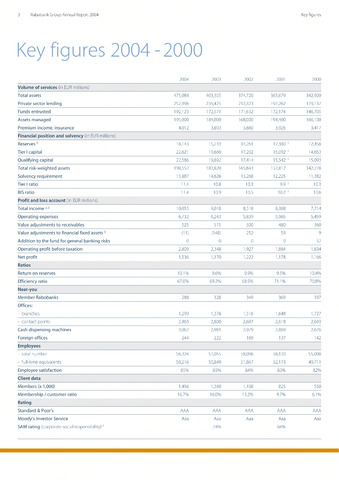
Key figures 2004-2000
3 Rabobank Group Annual Report 2004
Key figures
2004
2003
2002
2001
2000
Volume of services (in EUR millions)
Total assets
475,089
403,305
374,720
363,679
342,920
Private sector lending
252,996
235,425
212,323
197,262
179,137
Funds entrusted
192,123
172,571
171,632
172,174
146,705
Assets managed
195,000
184,000
168,000
194,400
166,100
Premium income, insurance
4,012
3,893
3,660
3,926
3,417
Financial position and solvency (in EUR millions)
Reserves2
18,143
15,233
14,261
12,380 1
12,458
Tier 1 capital
22,621
19,660
17,202
15,092
14,653
Qualifying capital
22,586
19,892
17,414
15,542 1
15,093
Total risk-weighted assets
198,552
182,820
165,843
152,812
142,278
Solvency requirement
15,887
14,626
13,268
12,225
11,382
Tier 1 ratio
11.4
10.8
10.3
9.9 1
10.3
BIS ratio
11.4
10.9
10.5
10.2 1
10.6
Profit and loss account (in EUR millions)
Total income 23
10,055
9,018
8,518
8,388
7,714
Operating expenses
6,732
6,243
5,839
5,965
5,459
Value adjustments to receivables
525
575
500
480
360
Value adjustments to financial fixed assets 3
(11)
(148)
252
59
9
Addition to the fund for general banking risks
0
0
0
0
52
Operating profit before taxation
2,809
2,348
1,927
1,884
1,834
Net profit
1,536
1,370
1,222
1,178
1,166
Ratios.*!
Return on reserves
10.1%
9.6%
9.9%
9.5%
10.4%
Efficiency ratio
67.0%
69.2%
68.5%
71.1%
70.8%
Near-you
Member Rabobanks
288
328
349
369
397
Offices:
- branches
1,299
1,378
1,516
1,648
1,727
- contact points
2,965
2,800
2,697
2,618
2,693
Cash dispensing machines
3,062
2,981
2,979
2,889
2,676
Foreign offices
244
222
169
137
142
Employees
- total number
56,324
57,055
58,096
58,120
55,098
- full-time equivalents
50,216
50,849
51,867
52,173
49,711
Employee satisfaction 85% 85% 84% 83% 82%
Client data
Members (x 1,000)
1,456
1,360
1,108
825
550
Membership customer ratio
16.7%
16.0%
13.2%
9.7%
6.1%
Standard Poor's
AAA
AAA
AAA
AAA
AAA
Moody's Investor Service
Aaa
Aaa
Aaa
Aaa
Aaa
SAM rating (corporate social responsibility)4
74%
64%