-
-
Inhoudsopgave Voorwoord Bestuursverslag Corporate governance Consolidated Financial Statements Company Financial Statements Pillar 3
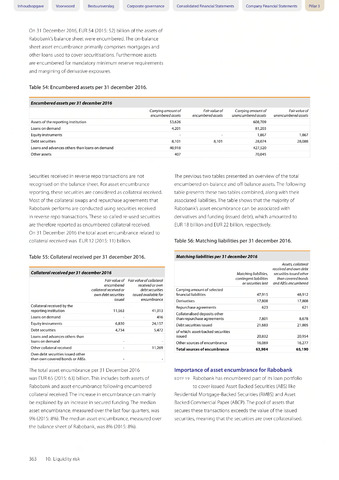
Encumbered assets per 31 december 2016
Carrying amount of
encumbered assets
Fair value of
encumbered assets
Carrying amount of
unencumbered assets
Fair value of
unencumbered assets
Assets ofthe reporting institution
53,626
608,709
Loans on demand
4,201
81,203
Equity instruments
1,867
1,867
Debt securities
8,101
8,101
28,074
28,088
Loans and advances others than loans on demand
40,918
427,520
Other assets
407
70,045
On 31 December 2016, EUR 54 (2015: 52) billion ofthe assets of
Rabobank's balance sheet were encumbered.The on-balance
sheet asset encumbrance primarily comprises mortgages and
other loans used to cover securitisations. Furthermore assets
are encumbered for mandatory minimum reserve requirements
and margining of derivative exposures.
Table 54: Encumbered assets per 31 december 2016.
Securities received in reverse repo transactions are not
recognised on the balance sheet. For asset encumbrance
reporting, these securities are considered as collateral received.
Most ofthe collateral swaps and repurchase agreements that
Rabobank performs are conducted using securities received
in reverse repo transactions. These so-called re-used securities
are therefore reported as encumbered collateral received.
On 31 December 2016 the total asset encumbrance related to
collateral received was EUR 12 (2015:11) billion.
Table 55: Collateral received per 31 december 2016.
Collateral received per 31 december20 7 6
Fair value of Fair value of col la teral
encumbered received or own
collateral received or debt securities
own debt securities issued available for
issued encumbrance
Collateral received by the
reporting institution 11,563 41,313
Loans on demand - 416
Equity instruments 6,830 24,157
Debt securities 4,734 5,472
Loans and advances others than
loans on demand
Other collateral received - 11,269
Own debt securities issued other
than own covered bonds or ABSs
The total asset encumbrance per 31 December 2016
was EUR 65 (2015: 63) billion.This includes both assets of
Rabobank and asset encumbrance following encumbered
collateral received.The increase in encumbrance can mainly
be explained by an increase in secured funding. The median
asset encumbrance, measured over the last four quarters, was
9% (2015: 8%).The median asset encumbrance, measured over
the balance sheet of Rabobank, was 8% (2015:8%).
The previous two tables presented an overview of the total
encumbered on-balance and off-balance assets. The following
table presents these two tables combined, along with their
associated liabilities.The table shows that the majority of
Rabobank's asset encumbrance can be associated with
derivatives and funding (issued debt), which amounted to
EUR 18 billion and EUR 22 billion, respectively.
Table 56: Matching liabilities per 31 december 2016.
Importance of asset encumbrance for Rabobank
edtf 19 Rabobank has encumbered part of its loan portfolio
to cover issued Asset Backed Securities (ABS) like
Residential Mortgage-Backed Securities (RMBS) and Asset
Backed Commercial Paper (ABCP).The pool of assets that
secures these transactions exceeds the value ofthe issued
securities, meaning that the securities are over collateralised.
Matching liabilities per 31 december 2016
Matching liabilities,
con tingen t liabilities
or securities lent
Assets, collateral
received and own debt
securities issued other
than covered bonds
and ABSs encumbered
Carrying amount of selected
financial liabilities
47,915
48,912
Derivatives
17,808
17,808
Repurchase agreements
623
621
Collateralised deposits other
than repurchase agreements
7,801
8,678
Debt securities issued
21,683
21,805
of which: asset-backed securities
issued
20,832
20,954
Other sources of encumbrance
16,069
16,277
Total sources of encumbrance
63,984
65,190
363 10. Liquidity risk