Inhoudsopgave Voorwoord Bestuursverslag Corporate governance
Consolidated Financial Statements Company Financial Statements Pillar 3
some fluctuations being driven by client related deals and
volatility in the financial markets.
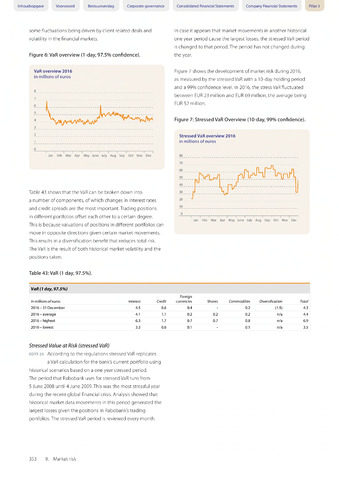
Figure 6: VaR overview (1-day, 97.5% confidence).
VaR overview 2016
in millions of euros
8
7
2
1
0
i I I I I I I I I I I I
Jan Feb Mar Apr May June July Aug Sep Oct Nov Dec
Table 43 shows that the VaR can be broken down into
a number of components, of which changes in interest rates
and credit spreads are the most important. Trading positions
in different portfolios offset each other to a certain degree.
This is because valuations of positions in different portfolios can
move in opposite directions given certain market movements.
This results in a diversification benefit that reduces total risk.
The VaR is the result of both historical market volatility and the
positions taken.
Table 43: VaR (1 day, 97.5%).
In case it appears that market movements in another historical
one year period cause the largest losses, the stressed VaR period
is changed to that period.The period has not changed during
the year.
Figure 7 shows the development of market risk during 2016,
as measured by the stressed VaR with a 10-day holding period
and a 99% confidence level. In 2016, the stress VaR fluctuated
between EUR 23 million and EUR 69 million, the average being
EUR 52 million.
Figure 7: Stressed VaR Overview (10-day, 99% confidence).
Stressed VaR overview 2016
in millions of euros
80
70
10
0
I I I I I I I I I I I I
Jan Feb Mar Apr May June July Aug Sep Oct Nov Dec
VaR (1 day, 97.5%)
Foreign
in millions of euros Interest Credit currencies Shares Commodities Diversification Total
2016-31 December 4.5 0.6 0.4 - 0.2 (1.5) 4.3
2016-average 4.1 1.1 0.2 0.2 0.2 n/a 4.4
2016-highest 6.3 1.7 0.7 0.7 0.8 n/a 6.9
2016-lowest 3.3 0.6 0.1 - 0.1 n/a 3.5
Stressed Value at Risk (stressed VaR)
EDTF2S According to the regulations stressed VaR replicates
a VaR calculation for the bank's current portfolio using
historical scenarios based on a one year stressed period.
The period that Rabobank uses for stressed VaR runs from
5 June 2008 until 4 June 2009.This was the most stressful year
during the recent global financial crisis. Analysis showed that
historical market data movements in this period generated the
largest losses given the positions in Rabobank's trading
portfolios. The stressed VaR period is reviewed every month.
353 9. Market risk