-
-
Inhoudsopgave Voorwoord Bestuursverslag Corporate governance
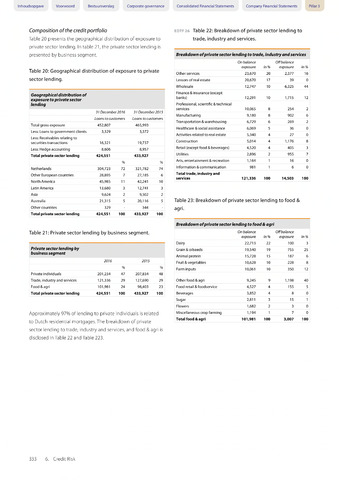
Composition of the credit portfolio
Table 20 presents the geographical distribution of exposure to
private sector lending. In table 21, the private sector lending is
presented by business segment.
Table 20: Geographical distribution of exposure to private
sector lending.
Geographical distribution of
exposure to private sector
lending
31 December 2016 31 December 2015
Loans to customers Loans to customers
Total gross exposure
452,807
465,993
Less: Loans to government clients
3,329
3,372
Less: Receivables relating to
securities transactions
16,321
19,737
Less: Hedge accounting
8,606
8,957
Total private sector lending
424,551
433,927
Netherlands
304,723
72
321,782
74
Other European countries
28,895
7
27,185
6
North America
45,985
11
42,241
10
Latin America
13,680
3
12,741
3
Asia
9,624
2
9,502
2
Australia
21,315
5
20,116
5
Other countries
329
344
Total private sector lending
424,551
100
433,927
100
Table 21Private sector lending by business segment.
Private sector lending by
business segment
2016
2015
Private individuals
201,234
47
207,834
48
Trade, industry and services
121,336
29
127,690
29
Food agri
101,981
24
98,403
23
Total private sector lending
424,551
100
433,927
100
Approximately 97% of lending to private individuals is related
to Dutch residential mortgages. The breakdown of private
sector lending to trade, industry and services, and food agri is
disclosed in Table 22 and Table 223.
Consolidated Financial Statements Company Financial Statements Pillar 3
EDTF26 Table 22: Breakdown of private sector lending to
trade, industry and services.
Breakdown of private sector lending to trade, industry and services
On balance
exposure
In
Off balance
exposure
In
Other services
23,670
20
2,377
16
Lessors of real estate
20,670
17
39
0
Wholesale
12,747
10
6,325
44
Finance insurance (except
banks)
12,291
10
1,715
12
Professional, scientific technical
services
10,065
8
254
2
Manufacturing
9,180
8
902
6
Transportation warehousing
6,729
6
269
2
Healthcare social assistance
6,069
5
36
0
Activities related to real estate
5,340
4
27
0
Construction
5,014
4
1,176
8
Retail (except food beverages)
4,520
4
405
3
Utilities
2,896
2
955
7
Arts, entertainment recreation
1,164
1
16
0
Information communication
981
1
6
0
Total trade, industry and
services
121,336
100
14,503
100
Table 23: Breakdown of private sector lending to food
agri.
Breakdown of private sector lending to food agri
On balance
exposure
In
Off balance
exposure
In
Dairy
22,713
22
100
3
Grain oilseeds
19,540
19
755
25
Animal protein
15,728
15
187
6
Fruit vegetables
10,628
10
228
8
Farm inputs
10,061
10
350
12
Other food agri
9,245
9
1,198
40
Food retail &foodservice
4,527
4
155
5
Beverages
3,852
4
8
0
Sugar
2,811
3
15
1
Flowers
1,682
2
3
0
Miscellaneous crop farming
1,194
1
7
0
Total food agri
101,981
100
3,007
100
333 6. Credit Risk