-
-
-
-
-
-
-
-
-
-
-
-
-
-
-
-
-
-
-
-
-
Inhoudsopgave Voorwoord Bestuursverslag Corporate governance Consolidated Financial Statements Company Financial Statements Pillar 3
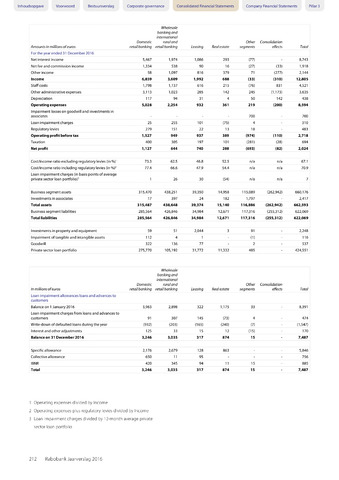
Amounts in millions of euros
Domestic
retail banking
Wholesale
banking and
international
rural and
retail banking
Leasing
Real estate
Other
segments
Consolidation
effects
Total
For the year ended 31 December 2016
Net interest income
5,467
1,974
1,086
293
(77)
8,743
Net fee and commission income
1,334
538
90
16
(27)
(33)
1,918
Other income
58
1,097
816
379
71
(277)
2,144
Income
6,859
3,609
1,992
688
(33)
(310)
12,805
Staff costs
1,798
1,137
616
215
(76)
831
4,521
Other administrative expenses
3,113
1,023
285
142
245
(1,173)
3,635
Depreciation
117
94
31
4
50
142
438
Operating expenses
5,028
2,254
932
361
219
(200)
8,594
Impairment losses on goodwill and investments in
associates
700
700
Loan impairment charges
25
255
101
(75)
4
310
Regulatory levies
279
151
22
13
18
483
Operating profit before tax
1,527
949
937
389
(974)
(110)
2,718
Taxation
400
305
197
101
(281)
(28)
694
Net profit
1,127
644
740
288
(693)
(82)
2,024
Cost/income ratio excluding regulatory levies (in %)1
73.3
62.5
46.8
52.5
n/a
n/a
67.1
Cost/income ratio including regulatory levies (in %)2
77.4
66.6
47.9
54.4
n/a
n/a
70.9
Loan impairment charges (in basis points of average
private sector loan portfolio)3
1
26
30
(54)
n/a
n/a
7
Business segment assets
315,470
438,251
39,350
14,958
115,089
(262,942)
660,176
Investments in associates
17
397
24
182
1,797
2,417
Total assets
315,487
438,648
39,374
15,140
116,886
(262,942)
662,593
Business segment liabilities
285,564
426,846
34,984
12,671
117,316
(255,312)
622,069
Total liabilities
285,564
426,846
34,984
12,671
117,316
(255,312)
622,069
Investments in property and equipment
59
51
2,044
3
91
2,248
Impairment of tangible and intangible assets
112
4
1
(1)
116
Goodwill
322
136
77
2
537
Private sector loan portfolio
275,770
105,192
31,772
11,332
485
424,551
in millions of euros
Domestic
retail banking
Wholesale
banking and
international
rural and
retail banking
Leasing
Real estate
Other
segments
Consolidation
effects
Total
Loan impairment allowances loans and advances to
customers
Balance on 1 January 2016
3,963
2,898
322
1,175
33
8,391
Loan impairment charges from loans and advances to
customers
91
307
145
(73)
4
474
Write-down of defaulted loans during the year
(932)
(203)
(165)
(240)
(7)
(1,547)
Interest and other adjustments
125
33
15
12
(15)
170
Balance on 31 December 2016
3,246
3,035
317
874
15
7,487
Specific allowance
2,176
2,679
128
863
5,846
Collective allowance
650
11
95
756
IBNR
420
345
94
11
15
885
Total
3,246
3,035
317
874
15
7,487
1 Operating expenses divided by Income
2 Operating expenses plus regulatory levies divided by Income
3 Loan impairment charges divided by 12-month average private
sector loan portfolio
212 Rabobank Jaarverslag 2016