-
-
-
-
-
-
-
-
-
-
-
-
-
-
-
-
-
-
-
Inhoudsopgave Voorwoord Bestuursverslag Corporate governance Consolidated Financial Statements Company Financial Statements Pillar 3
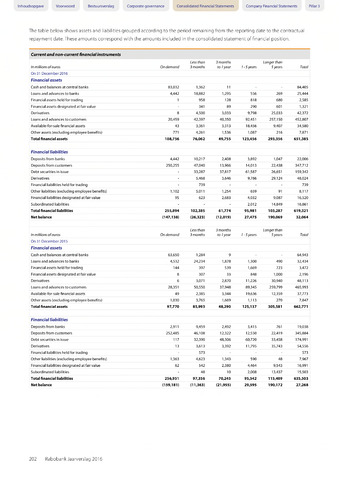
The table below shows assets and liabilities grouped according to the period remaining from the reporting date to the contractual
repayment date.These amounts correspond with the amounts included in the consolidated statement of financial position.
Current and non-current financial instruments
in millions of euros
On demand
Less than
3 months
3 months
to 1 year
7 - 5 years
Longer than
5 years
Total
On 31 December 2016
Financial assets
Cash and balances at central banks
83,032
1,362
11
84,405
Loans and advances to banks
4,442
18,882
1,295
556
269
25,444
Financial assets held for trading
1
958
128
818
680
2,585
Financial assets designated at fair value
341
89
290
601
1,321
Derivatives
8
4,500
3,033
9,798
25,033
42,372
Loans and advances to customers
20,459
42,397
40,350
92,451
257,150
452,807
Available-for-sale financial assets
43
3,361
3,313
18,456
9,407
34,580
Other assets (excluding employee benefits)
771
4,261
1,536
1,087
216
7,871
Total financial assets
108,756
76,062
49,755
123,456
293,356
651,385
Financial liabilities
Deposits from banks
4,442
10,217
2,408
3,892
1,047
22,006
Deposits from customers
250,255
47,040
13,966
14,013
22,438
347,712
Debt securities in issue
33,287
37,817
61,587
26,651
159,342
Derivatives
5,468
3,646
9,786
29,124
48,024
Financial liabilities held for trading
739
739
Other liabilities (excluding employee benefits)
1,102
5,011
1,254
659
91
8,117
Financial liabilities designated at fair value
95
623
2,683
4,032
9,087
16,520
Subordinated liabilities
2,012
14,849
16,861
Total financial liabilities
255,894
102,385
61,774
95,981
103,287
619,321
Net balance
(147,138)
(26,323)
(12,019)
27,475
190,069
32,064
in millions of euros
On demand
Less than
3 months
3 months
to 1 year
7 -5 years
Longer than
5 years
Total
On 31 December 2015
Financial assets
Cash and balances at central banks
63,650
1,284
9
64,943
Loans and advances to banks
4,532
24,234
1,878
1,300
490
32,434
Financial assets held for trading
144
397
539
1,669
723
3,472
Financial assets designated at fair value
8
307
33
848
1,000
2,196
Derivatives
6
3,071
2,870
11,226
30,940
48,113
Loans and advances to customers
28,351
50,550
37,948
89,345
259,799
465,993
Available-for-sale financial assets
49
2,385
3,344
19,636
12,359
37,773
Other assets (excluding employee benefits)
1,030
3,765
1,669
1,113
270
7,847
Total financial assets
97,770
85,993
48,290
125,137
305,581
662,771
Financial liabilities
Deposits from banks
2,911
9,459
2,492
3,415
761
19,038
Deposits from customers
252,485
46,108
12,322
12,550
22,419
345,884
Debt securities in issue
117
32,390
48,306
60,720
33,458
174,991
Derivatives
13
3,613
3,392
11,795
35,743
54,556
Financial liabilities held for trading
573
573
Other liabilities (excluding employee benefits)
1,363
4,623
1,343
590
48
7,967
Financial liabilities designated at fair value
62
542
2,380
4,464
9,543
16,991
Subordinated liabilities
48
10
2,008
13,437
15,503
Total financial liabilities
256,951
97,356
70,245
95,542
115,409
635,503
Net balance
(159,181)
(11,363)
(21,955)
29,595
190,172
27,268
202 Rabobank Jaarverslag 2016