Inhoudsopgave Bestuursverslag Corporate governance Jaarrekening Rabobank Groep Jaarrekening Rabobank
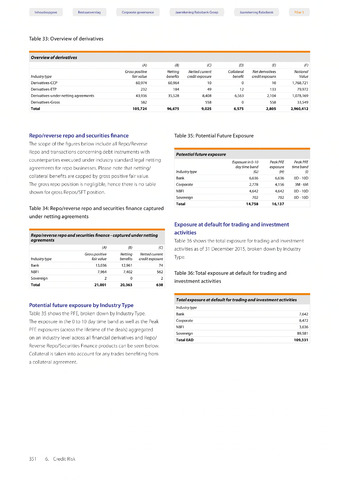
Table 33: Overview of derivatives
Overview of derivatives
(A)
(B)
(C)
(D)
(E)
(F)
Gross positive
Netting
Netted current
Collateral
Net derivatives
Notional
Industry type
fair value
benefits
credit exposure
benefit
credit exposure
Value
Derivatives-CCP
60,974
60,964
10
0
10
1,768,721
Derivatives-ETP
232
184
49
12
133
79,972
Derivatives-under netting agreements
43,936
35,528
8,408
6,563
2,104
1,078,169
Derivatives-Gross
582
558
0
558
33,549
Total
105,724
96,675
9,025
6,575
2,805
2,960,412
Table 35: Potential Future Exposure
Potential future exposure
Industry type
Exposure in 0-10
day time band
(G)
Peak PFE
exposure
(H)
Peak PFE
time band
(D
Bank
6,636
6,636
0D-10D
Corporate
2,778
4,156
3M-6M
NBFI
4,642
4,642
0D-10D
Sovereign
702
702
0D-10D
Total
14,758
16,137
Repo/reverse repo and securities finance
The scope of the figures below include all Repo/Reverse
Repo and transactions concerning debt instruments with
counterparties executed under industry standard legal netting
agreements for repo businesses. Please note that netting/
collateral benefits are capped by gross positive fair value.
The gross repo position is negligible, hence there is no table
shown for gross Repos/SFT position.
Table 34: Repo/reverse repo and securities finance captured
under netting agreements
Exposure at default for trading and investment
activities
Table 36 shows the total exposure for trading and investment
activities as of 31 December 2015, broken down by Industry
Type.
Table 36: Total exposure at default for trading and
investment activities
Repo/reverse repo and securities finance -
agreements
captured under netting
(A)
(B)
(C)
Industry type
Gross positive
fair value
Netting
benefits
Netted current
credit exposure
Bank
13,036
12,961
74
NBFI
7,964
7,402
562
Sovereign
2
0
2
Total
21,001
20,363
638
Total exposure at default for trading and investment activities
Industry type
Bank
7,642
Corporate
8,472
NBFI
3,636
Sovereign
89,581
Total EAD
109,331
Potential future exposure by Industry Type
Table 35 shows the PFE, broken down by Industry Type.
The exposure in the 0 to 10 day time band as well as the Peak
PFE exposures (across the lifetime of the deals) aggregated
on an industry level across all financial derivatives and Repo/
Reverse Repo/Securities Finance products can be seen below.
Collateral is taken into account for any trades benefiting from
a collateral agreement.
351 6. Credit Risk