-
-
Inhoudsopgave Bestuursverslag Corporate governance
InTable 13 the exposure value which is covered by eligible
collateral and covered by guarantees and credit derivatives is
presented. Table 14 presents the exposure to which the SA is
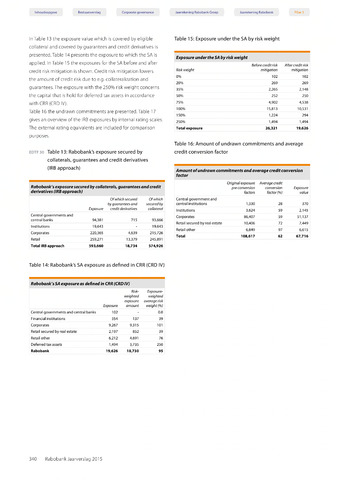
applied. InTable 15 the exposures for the SA before and after
credit risk mitigation is shown. Credit risk mitigation lowers
the amount of credit risk due to e.g. collateralization and
guarantees.The exposure with the 250% risk weight concerns
the capital that is hold for deferred tax assets in accordance
with CRR (CRD IV).
Table 16 the undrawn commitments are presented.Table 17
gives an overview of the IRB exposures by internal rating scales.
The external rating equivalents are included for comparison
purposes.
edtf 30 Table 13: Rabobank's exposure secured by
collaterals, guarantees and credit derivatives
(IRB approach)
Table 14: Rabobank's SA exposure as defined in CRR (CRD IV)
Jaarrekening Rabobank Groep Jaarrekening Rabobank
Table 16: Amount of undrawn commitments and average
credit conversion factor
Rabobank's exposure secured by collateralsguarantees and credit
derivatives (IRB approach)
Exposure
Of which secured
by guarantees and
credit derivatives
Of which
secured by
collateral
Central governments and
central banks
94,381
715
93,666
Institutions
19,643
19,643
Corporates
220,365
4,639
215,726
Retail
259,271
13,379
245,891
Total IRB approach
593,660
18,734
574,926
Rabobank's SA exposure as defined in CRR (CRD IV)
Exposure
Risk-
weighted
exposure
amount
Exposure-
weighted
average risk
weight
Central governments and central banks
102
0.0
Financial institutions
354
137
39
Corporates
9,267
9,315
101
Retail secured by real estate
2,197
852
39
Retail other
6,212
4,691
76
Deferred tax assets
1,494
3,735
250
Rabobank
19,626
18,730
95
Amount of undrawn commitments and average credit conversion
factor
Original exposure
pre conversion
factors
Average credit
conversion
factor
Exposure
value
Central government and
central institutions
1,330
28
370
Institutions
3,624
59
2,145
Corporates
86,407
59
51,137
Retail secured by real estate
10,406
72
7,449
Retail other
6,849
97
6,615
Total
108,617
62
67,716
Table 15: Exposure under the SA by risk weight
Exposure under the SA by risk weight
Risk weight
Before credit risk
mitigation
After credit risk
mitigation
0%
102
102
20%
269
269
35%
2,265
2,148
50%
252
250
75%
4,902
4,538
100%
15,813
10,531
150%
1,224
294
250%
1,494
1,494
Total exposure
26,321
19,626
340 Rabobank Jaarverslag 2015