Inhoudsopgave Bestuursverslag Corporate governance
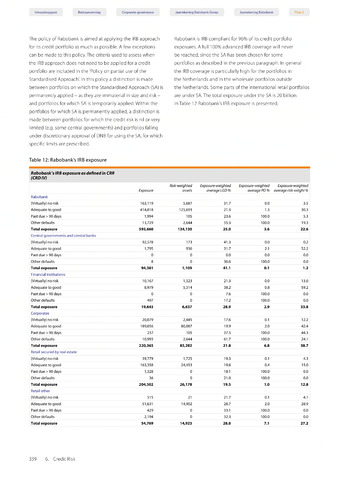
The policy of Rabobank is aimed at applying the IRB approach
for its credit portfolio as much as possible. A few exceptions
can be made to this policy. The criteria used to assess when
the IRB approach does not need to be applied for a credit
portfolio are included in the 'Policy on partial use of the
Standardised Approach'. In this policy a distinction is made
between portfolios on which the Standardised Approach (SA) is
permanently applied - as they are immaterial in size and risk -
and portfolios for which SA is temporarily applied. Within the
portfolios for which SA is permanently applied, a distinction is
made between portfolios for which the credit risk is nil or very
limited (e.g. some central governments) and portfolios falling
under discretionary approval of DNB for using the SA, for which
specific limits are prescribed.
Table 12: Rabobank's IRB exposure
Jaarrekening Rabobank Groep Jaarrekening Rabobank
Rabobank is IRB compliant for 96% of its credit portfolio
exposures. A full 100% advanced IRB coverage will never
be reached, since the SA has been chosen for some
portfolios as described in the previous paragraph. In general
the IRB coverage is particularly high for the portfolios in
the Netherlands and in the wholesale portfolios outside
the Netherlands. Some parts of the international retail portfolios
are under SA.The total exposure under the SA is 20 billion.
In Table 12 Rabobank's IRB exposure is presented.
Rabobank's IRB exposure as defined in CRR
(CRD IV)
Exposure
Risk-weighted
assets
Exposure-weighted
average LQD
Exposure-weigh ted
average PD
Exposure-weighted
average risk weight
Rabobank
(Virtually) no risk
163,119
5,687
31.7
0.0
3.5
Adequate to good
414,818
125,693
21.3
1.3
30.3
Past due 90 days
1,994
105
23.6
100.0
5.3
Other defaults
13,729
2,644
55.3
100.0
19.3
Total exposure
593,660
134,130
25.0
3.6
22.6
Central governments and central banks
(Virtually) no risk
92,578
173
41.3
0.0
0.2
Adequate to good
1,795
936
31.7
2.1
52.2
Past due >90 days
0
0
0.0
0.0
0.0
Other defaults
8
0
36.6
100.0
0.0
Total exposure
94,381
1,109
41.1
0.1
1.2
Financial institutions
(Virtually) no risk
10,167
1,323
21.3
0.0
13.0
Adequate to good
8,979
5,314
38.2
0.8
59.2
Past due >90 days
0
0
7.6
100.0
0.0
Other defaults
497
0
17.2
100.0
0.0
Total exposure
19,643
6,637
28.9
2.9
33.8
Corporates
(Virtually) no risk
20,079
2,445
17.6
0.1
12.2
Adequate to good
189,056
80,087
19.9
2.0
42.4
Past due 90 days
237
105
37.5
100.0
44.3
Other defaults
10,993
2,644
61.7
100.0
24.1
Total exposure
220,365
85,282
21.8
6.8
38.7
Retail secured by real estate
(Virtually) no risk
39,779
1,725
19.3
0.1
4.3
Adequate to good
163,358
24,453
19.6
0.4
15.0
Past due 90 days
1,328
0
18.1
100.0
0.0
Other defaults
36
0
21.0
100.0
0.0
Total exposure
204,502
26,178
19.5
1.0
12.8
Retail other
(Virtually) no risk
515
21
21.7
0.1
4.1
Adequate to good
51,631
14,902
28.7
2.0
28.9
Past due 90 days
429
0
33.1
100.0
0.0
Other defaults
2,194
0
32.3
100.0
0.0
Total exposure
54,769
14,923
28.8
7.1
27.2
339 6. Credit Risk