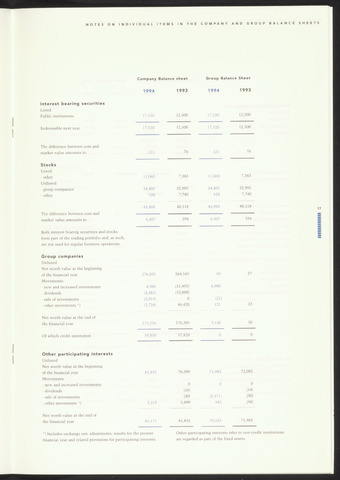
NOTES ON
INDIVIDUAL ITEMS IN THE COMPANY AND GROUP
BALANCE
SHEET
Company Balance
sheet
Group Balance
Sheet
1994
1993
1994
1993
Interest bearing securities
Listed
Public institutions
17,520
12,500
17,520
12,500
Redeemable next year
17,520
12,500
17,520
12,500
The difference between cost and
market value amounts to
225
76
225
76
Stocks
Listed:
- other
Unlisted:
11,060
7,383
11,060
7,383
- group companies
34,405
32,995
34,405
32,995
- other
528
7,740
528
7,740
The difference between cost and
45,993
48,118
45,993
48,118
6,307
294
6,307
294
market value amounts to
Both interest bearing securities and stocks
form part of the trading portfolio and, as such,
are not used for regular business operations.
Group companies
Unlisted
Net worth value at the beginning
of the financial year
276,395
264,165
50
27
Movements:
- new and increased investments
4,980
(21,492)
4,980
- dividends
- sale of investments
(3,381)
12,014)
(12,698)
0
(21)
- other movements
(2,724|
46,420
121
23
Net worth value at the end of
the financial year
273,256
276,395
5,130
50
Of which credit institution
59,850
57,829
0
0
Other participating interests
Unlisted
Net worth value at the beginning
of the financial year
Movements:
81,852
76,399
71,982
72,082
- new and increased investments
0
0
0
- dividends
(16)
(14)
- sale of investments
(30)
(2,371)
(30)
- other movements
3,319
5,499
942
(56)
Net worth value at the end of
the financial year
85,171
81,852
70,553
71,982
Includes exchange rate adjustments, results for the present
financial year and related provisions for participating interests.
Other participating interests refer to non-credit institutions
are regarded as part of the fixed assets.