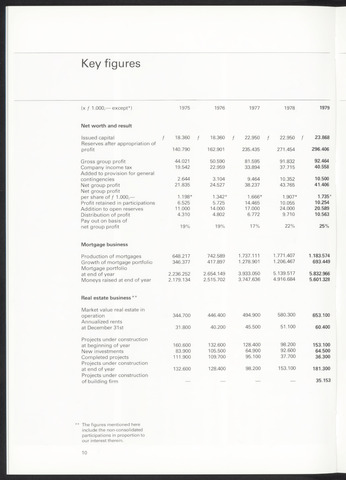
Key figures
(x 1.000,except*)
1975
1976
1977
1978
1979
Net worth and result
Issued capital
Reserves after appropriation of
18.360
f 18.360
f 22.950
f 22.950
23.868
profit
140.790
162.901
235.435
271.454
296.406
Gross group profit
44.021
50.590
81.595
91.832
92.464
Company income tax
Added to provision for general
19.542
22.959
33.894
37.715
40.558
contingencies
2.644
3.104
9.464
10.352
10.500
Net group profit
Net group profit
21.835
24.527
38.237
43.765
41.406
per share of 1.000,
1.198*
1.342*
1.666*
1.907*
1.735*
Profit retained in participations
6.525
5.725
14.465
10.055
10.254
Addition to open reserves
11.000
14.000
17.000
24.000
20.589
Distribution of profit
Pay out on basis of
4.310
4.802
6.772
9.710
10.563
net group profit
19%
19%
17%
22%
25%
Mortgage business
Production of mortgages
648.217
742.589
1.737.111
1.771.407
1.183.574
Growth of mortgage portfolio
Mortgage portfolio
346.377
417.897
1.278.901
1.206.467
693.449
at end of year
2.236.252
2.654.149
3.933.050
5.139.517
5.832.966
Moneys raised at end of year
Real estate business**
2.179.134
2.515.702
3.747.636
4.916.684
5.601.328
Market value real estate in
operation
Annualized rents
344.700
446.400
494.900
580.300
653.100
at December 31st
31.800
40.200
45.500
51.100
60.400
Projects under construction
at beginning of year
160.600
132.600
128.400
98.200
153.100
New investments
83.900
105.500
64.900
92.600
64.500
Completed projects
Projects under construction
111.900
109.700
95.100
37.700
36.300
at end of year
Projects under construction
132.600
128.400
98.200
153.100
181.300
of building firm
35.153
The figures mentioned here
include the non-consolidated
participations in proportion to
our interest therein.
10